Basic ECG 101
- Hani Albrahim, MD - Emergency Medicine Consultant
- Mustafa Samir - Emergency Medicine Physician
Introduction & History
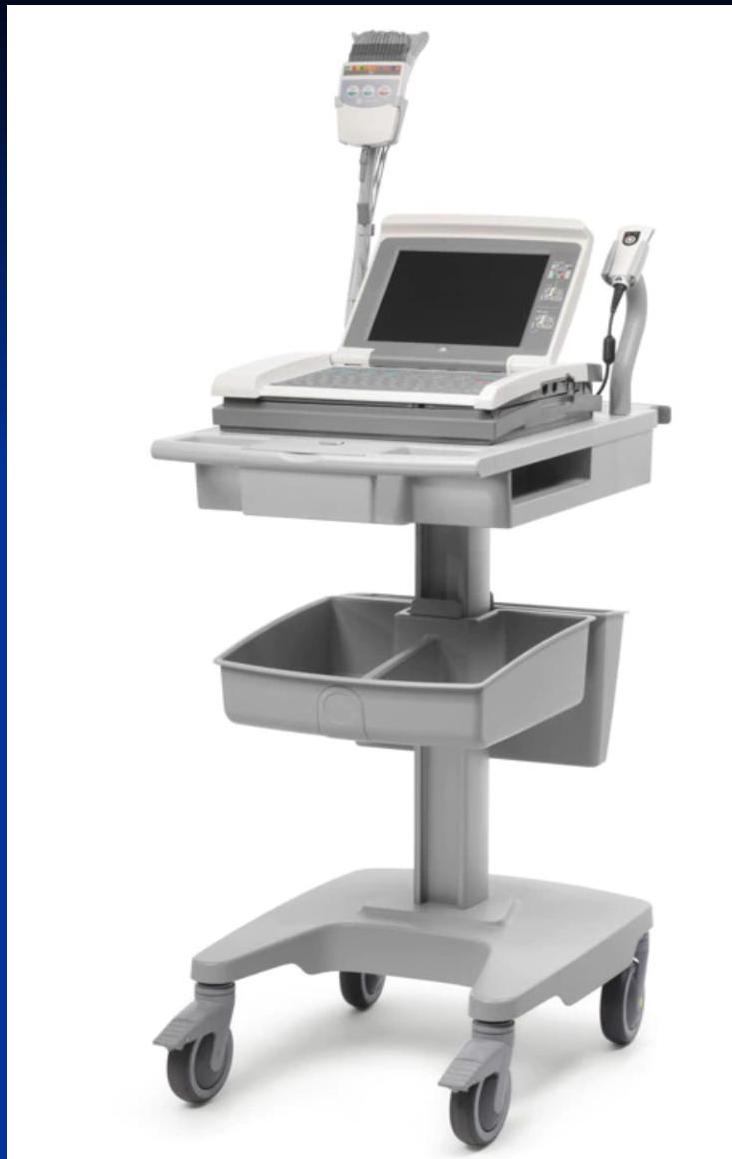
Early Electrocardiography
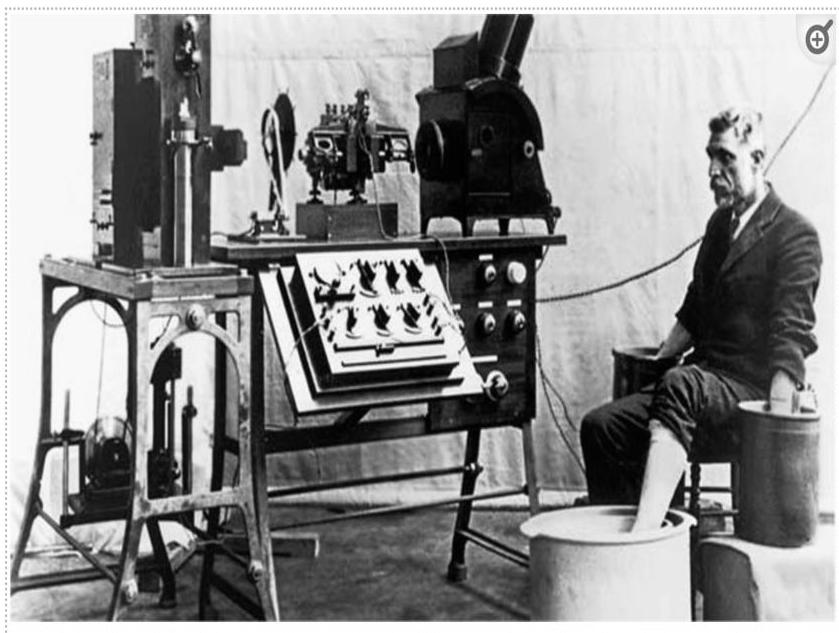 Old string galvanometer electrocardiograph showing the big machine with the patient rinsing his extremities in the cylindrical electrodes filled with electrolyte solution.
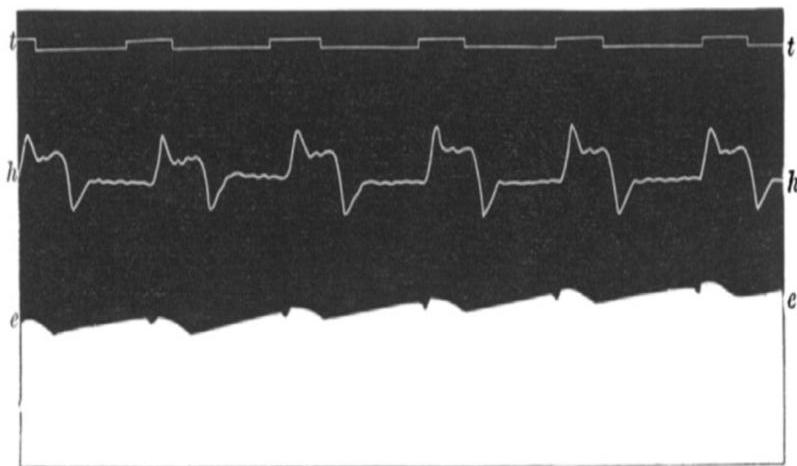 First human electrocardiogram recorded by Augustus D. Waller of St Mary’s Medical School showing simultaneous electrometer and cardiograph tracings.
Willem Einthoven (1860 – 1927)

- Dutch doctor and physiologist.
- He invented the first practical ECG in 1903.
- Received the Nobel Prize in Medicine in 1924.
ECG Basics
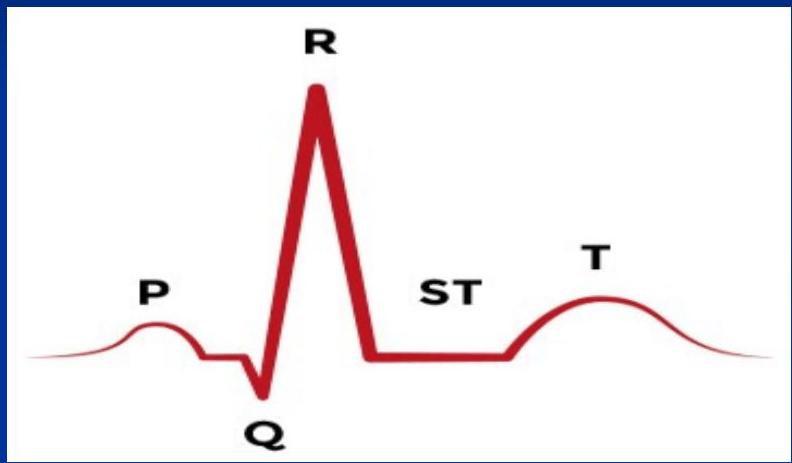
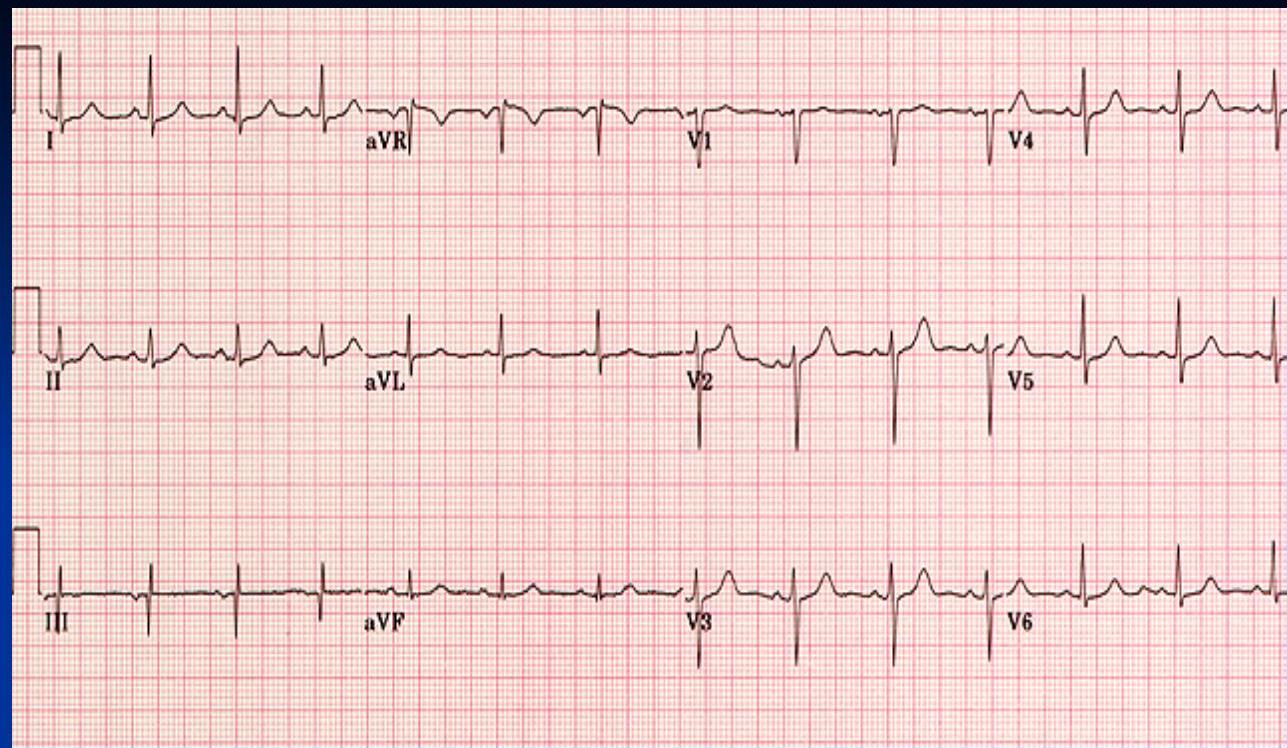
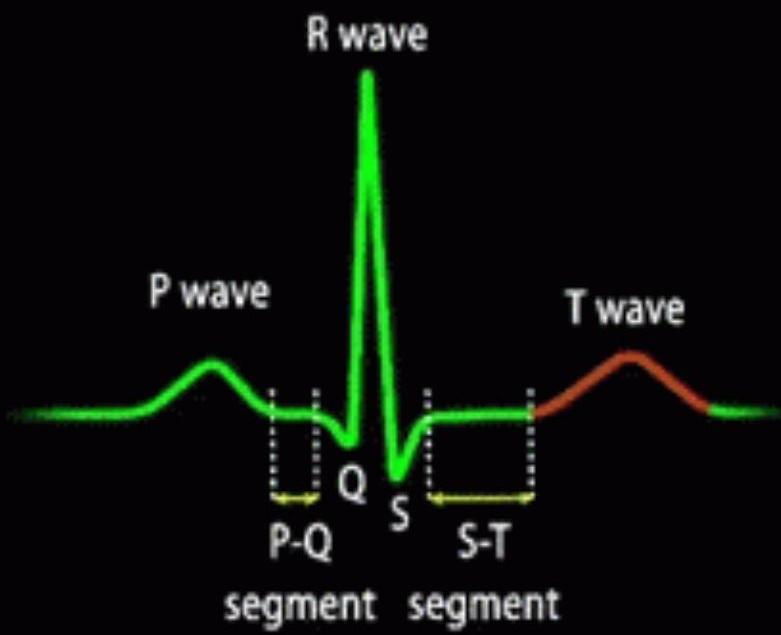
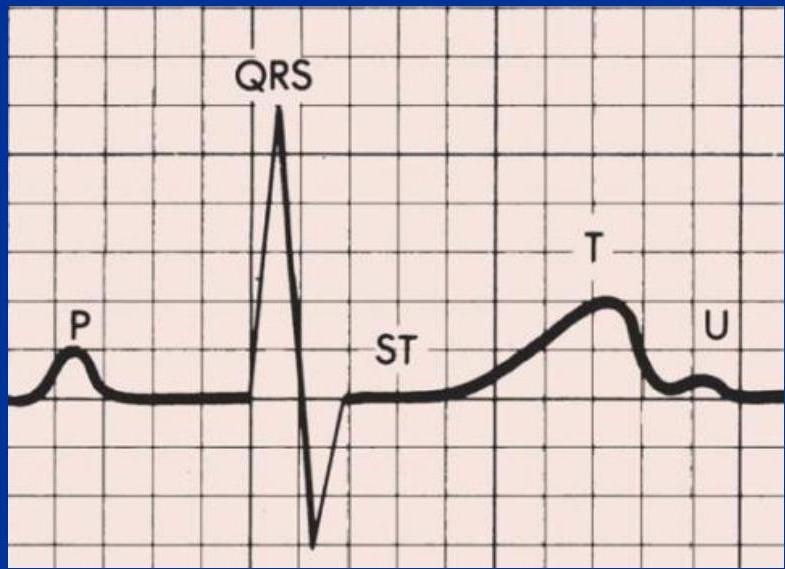
What is an Electrocardiogram (ECG)?
Composite of all action potentials of nodal and myocardial cells detected, amplified, and recorded by electrodes on arms, legs, and chest.
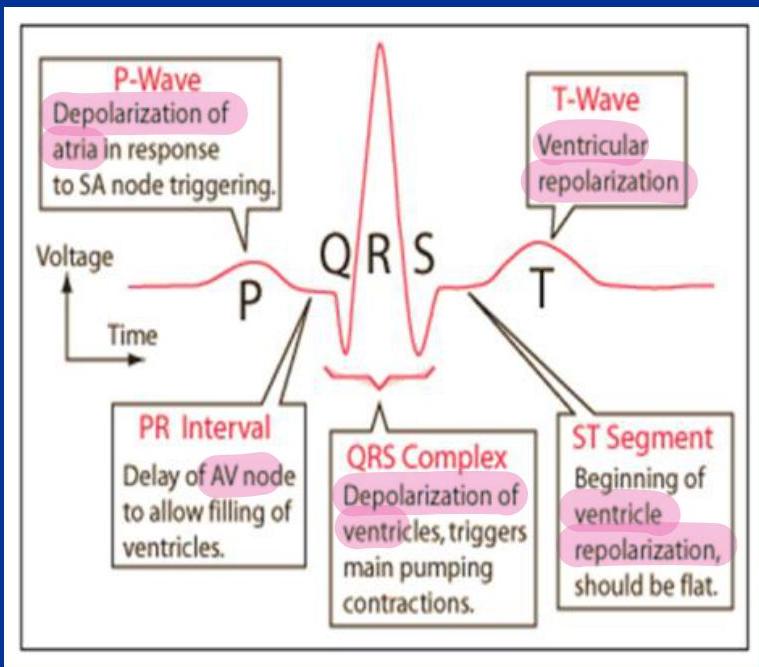

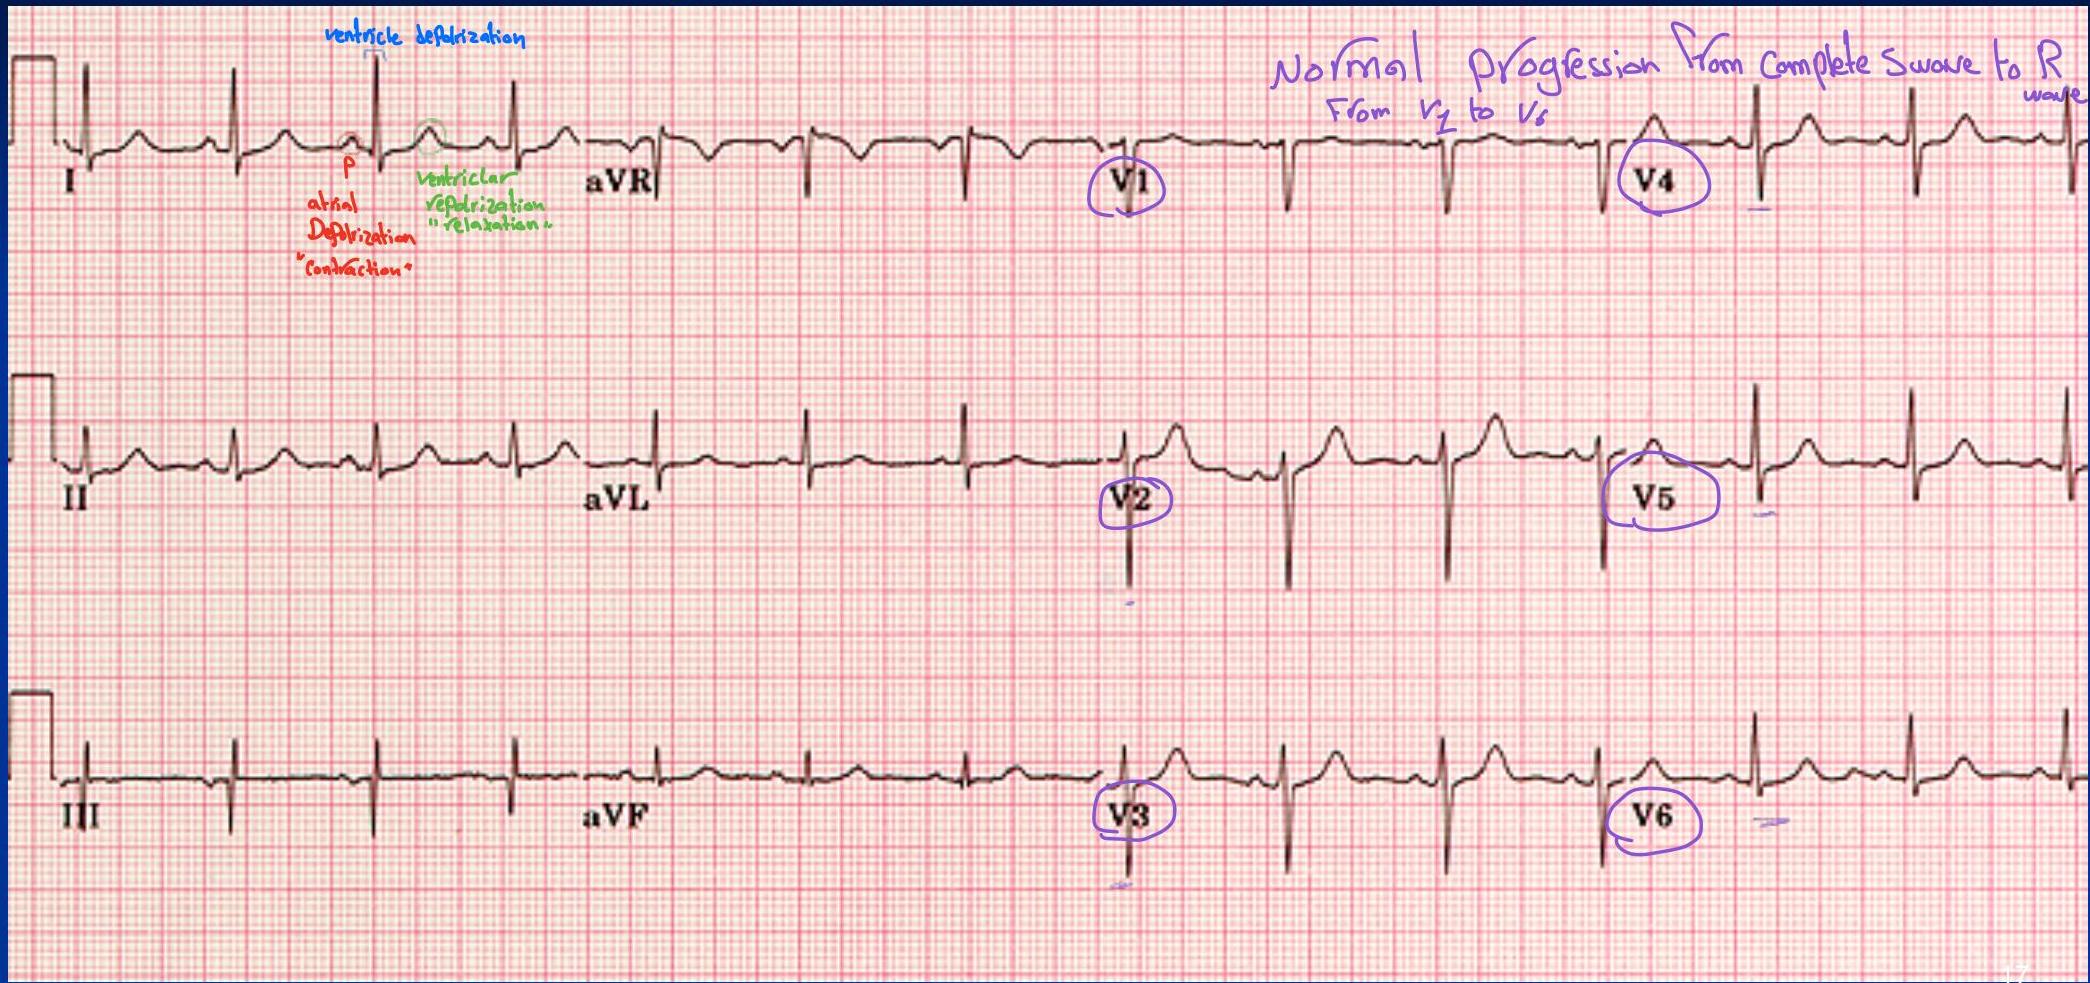
Where is atrial repolarization?
- It does not appear as a distinct wave on the ECG because it occurs during ventricular depolarization.
- The atrial repolarization wave has a low amplitude (low voltage) and is therefore masked by the much larger ventricular‑generated QRS complex.
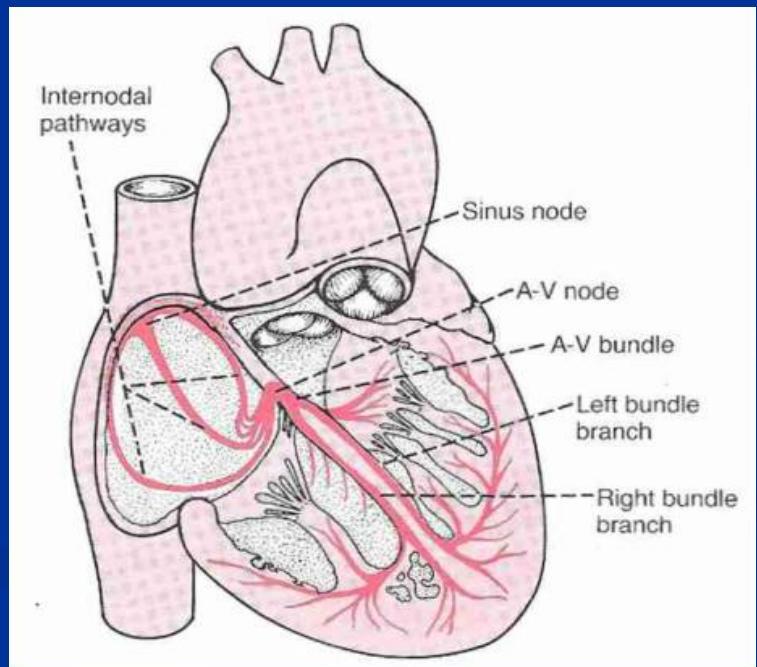
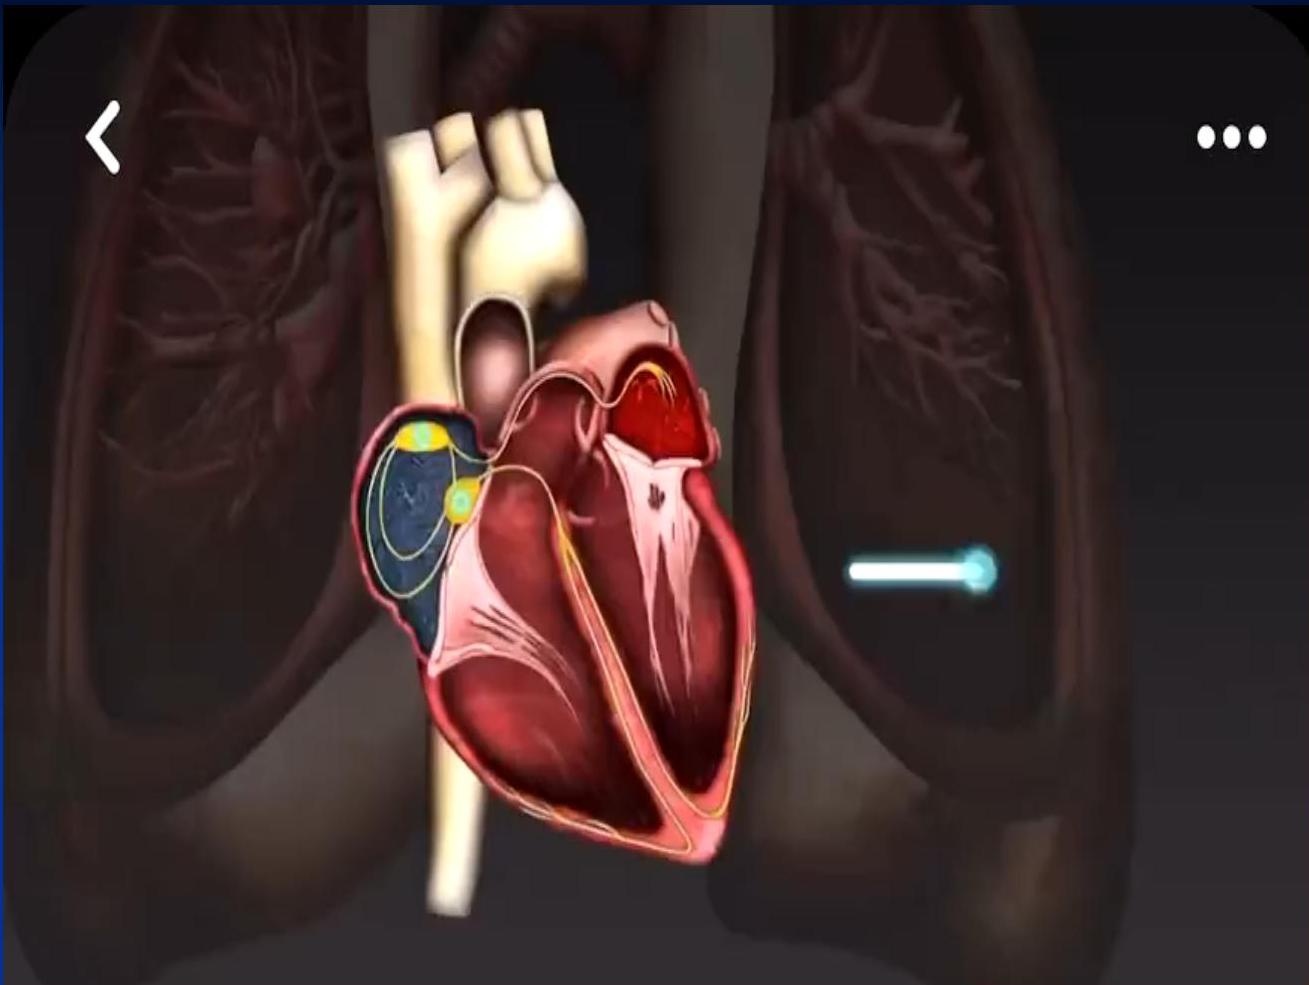
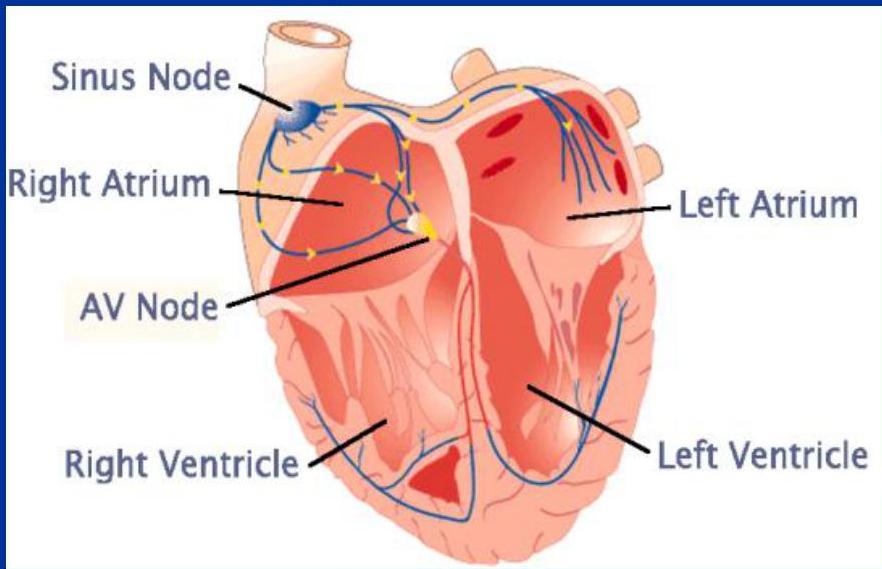
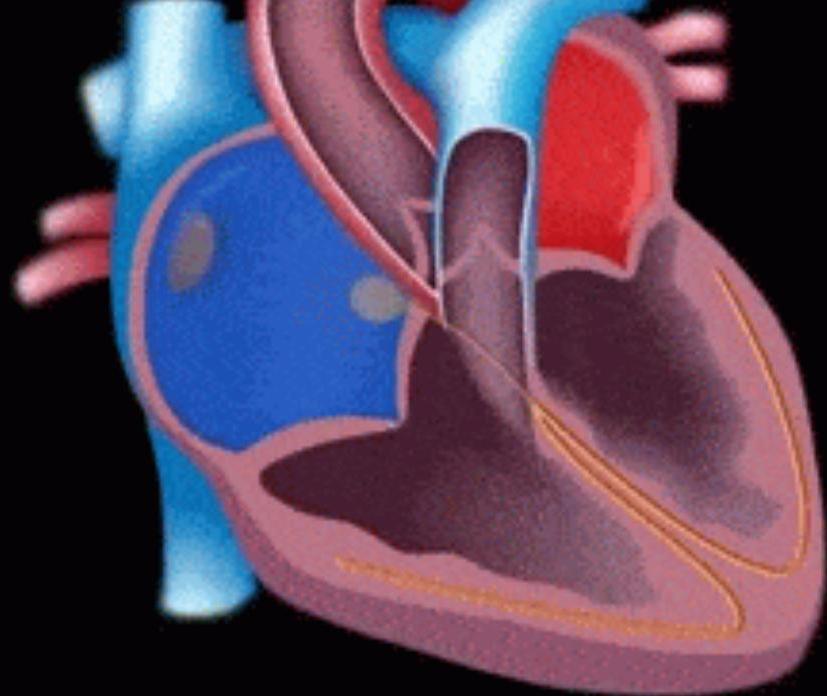
Anatomy & Conduction System
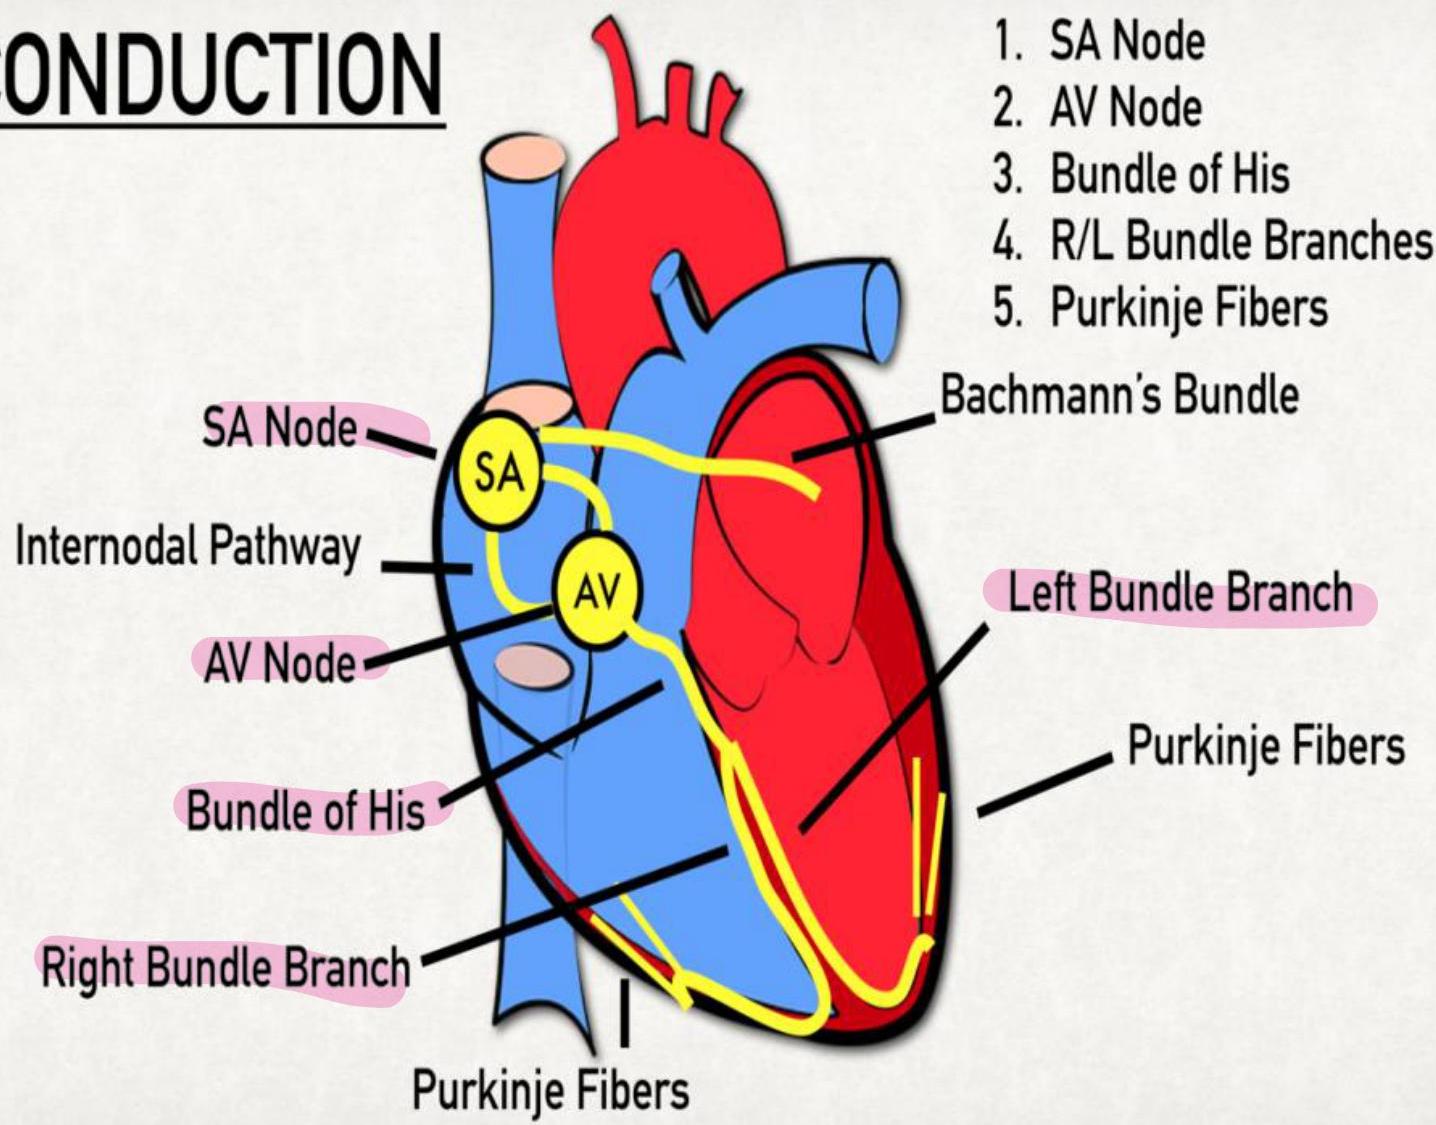
- SA Node (Pacemaker)
- AV Node
- Bundle of His
- R/L Bundle Branches
- Purkinje Fibers (Bachmann’s Bundle, Left Bundle Branch)
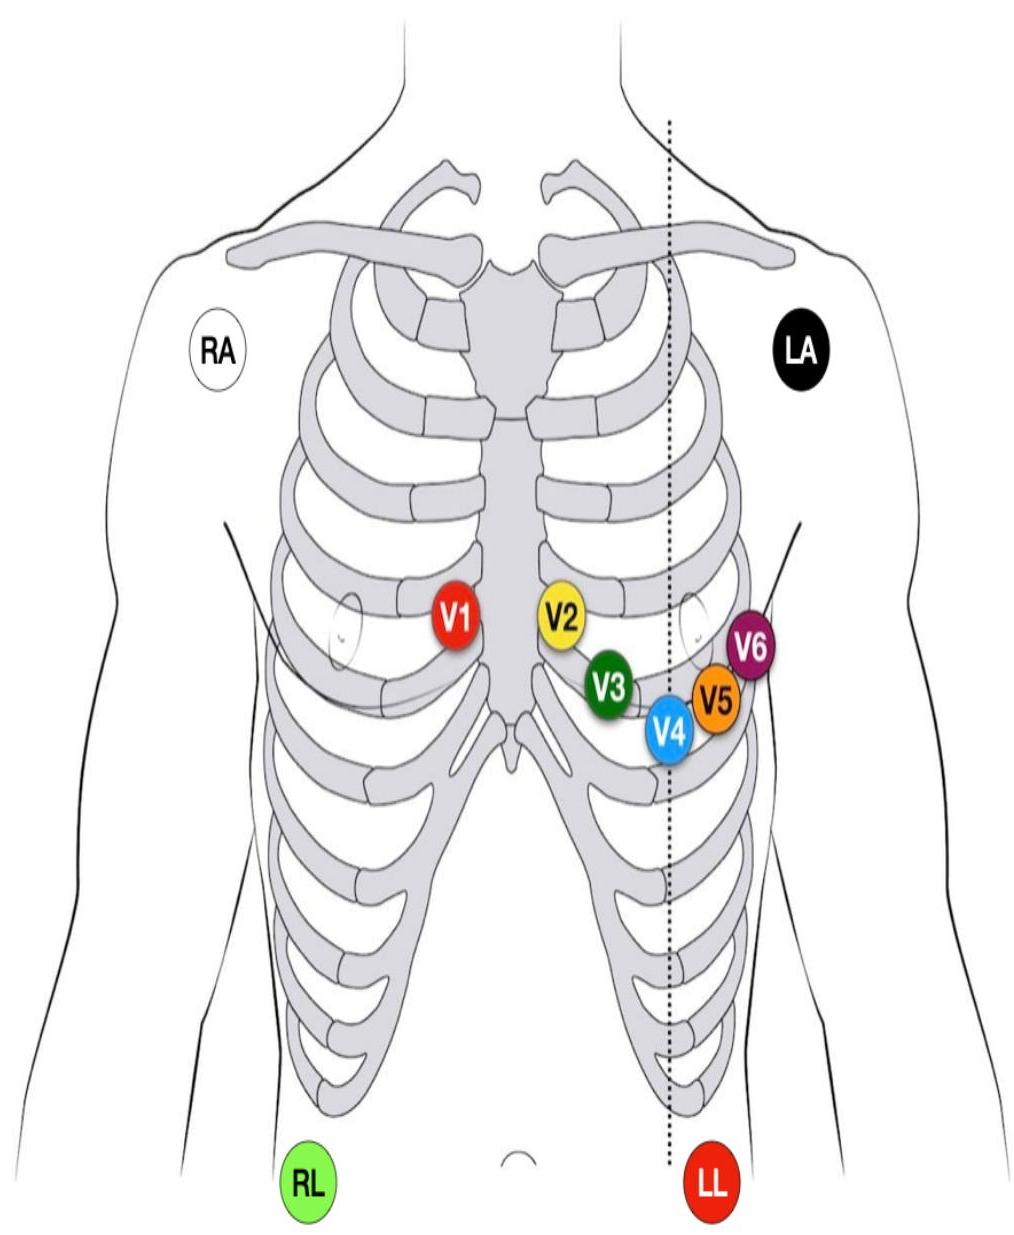
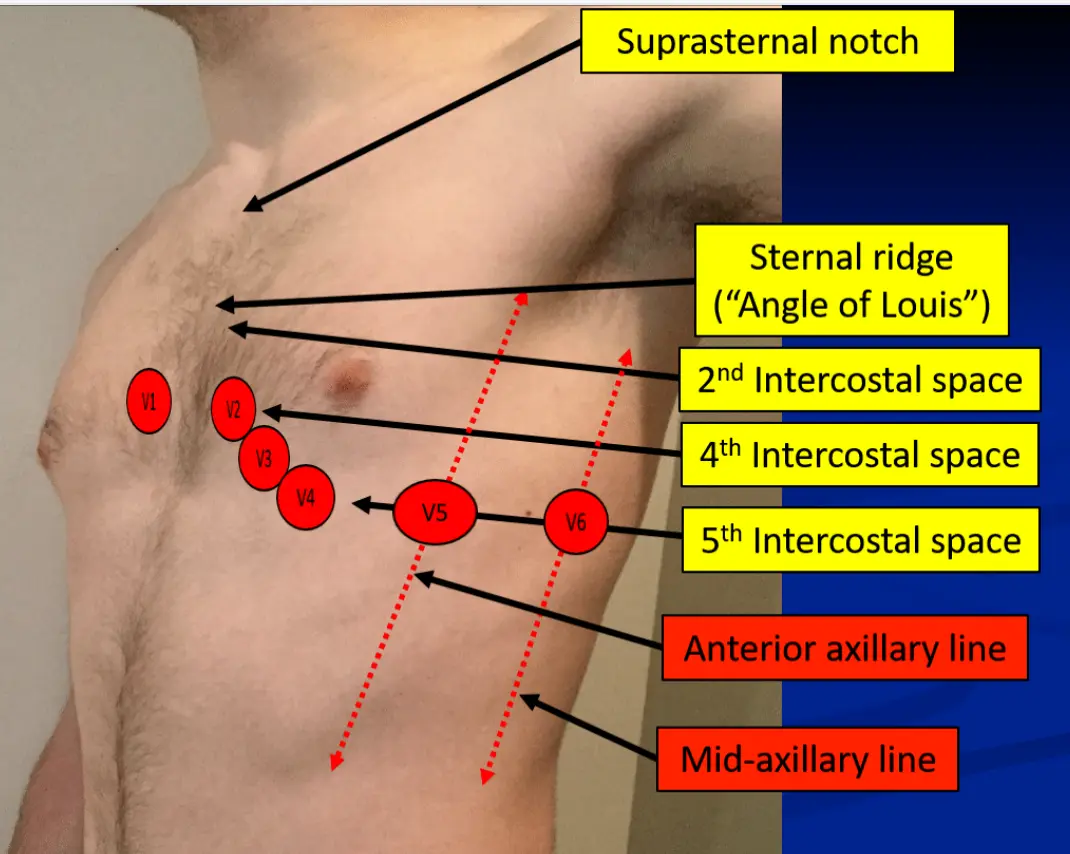
Lead Placement
- Suprasternal notch
- Sternal ridge (“Angle of Louis”): 2nd Intercostal space
- 4th Intercostal space
- 5th Intercostal space
- Anterior axillary line
- Mid-axillary line
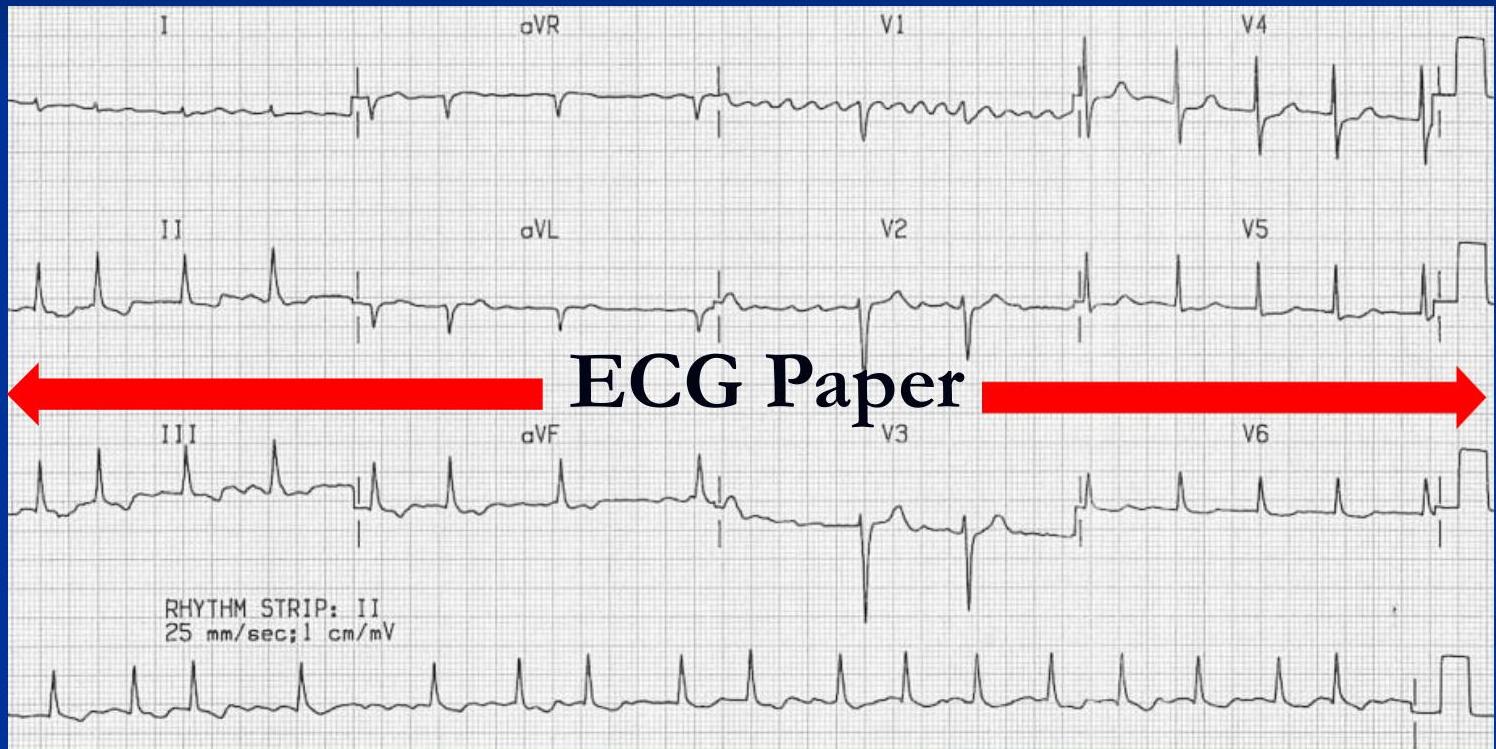
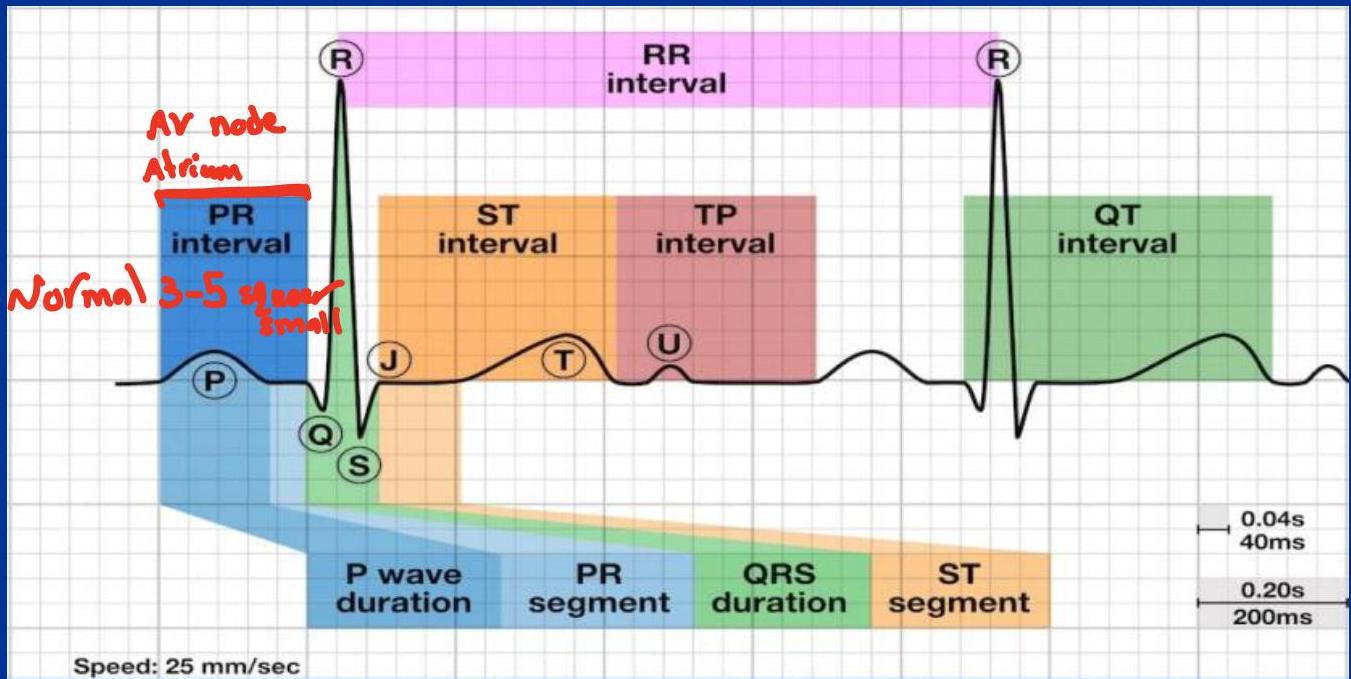
ECG Paper Standards
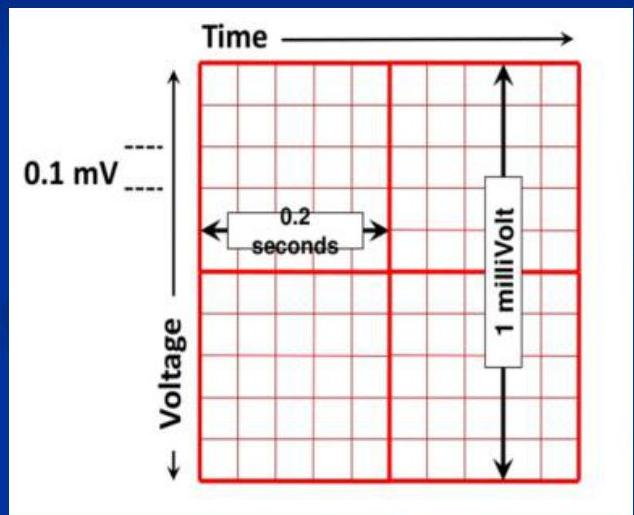
Horizontal (Time):
- 1 Small square = 0.04 second
- 1 Big square = 0.2 second
- 5 Big squares = 1 Second
Vertical (Voltage/Amplitude):
- 1 Small square = 0.1 mv
- 1 Big square = 0.5 mv
- 2 Big squares = 1 mv
The 10 Steps of ECG Interpretation
- Rate
- Rhythm
- Axis
- P wave
- PR interval
- QRS wave
- TP segment
- ST segment
- T wave
- QT interval
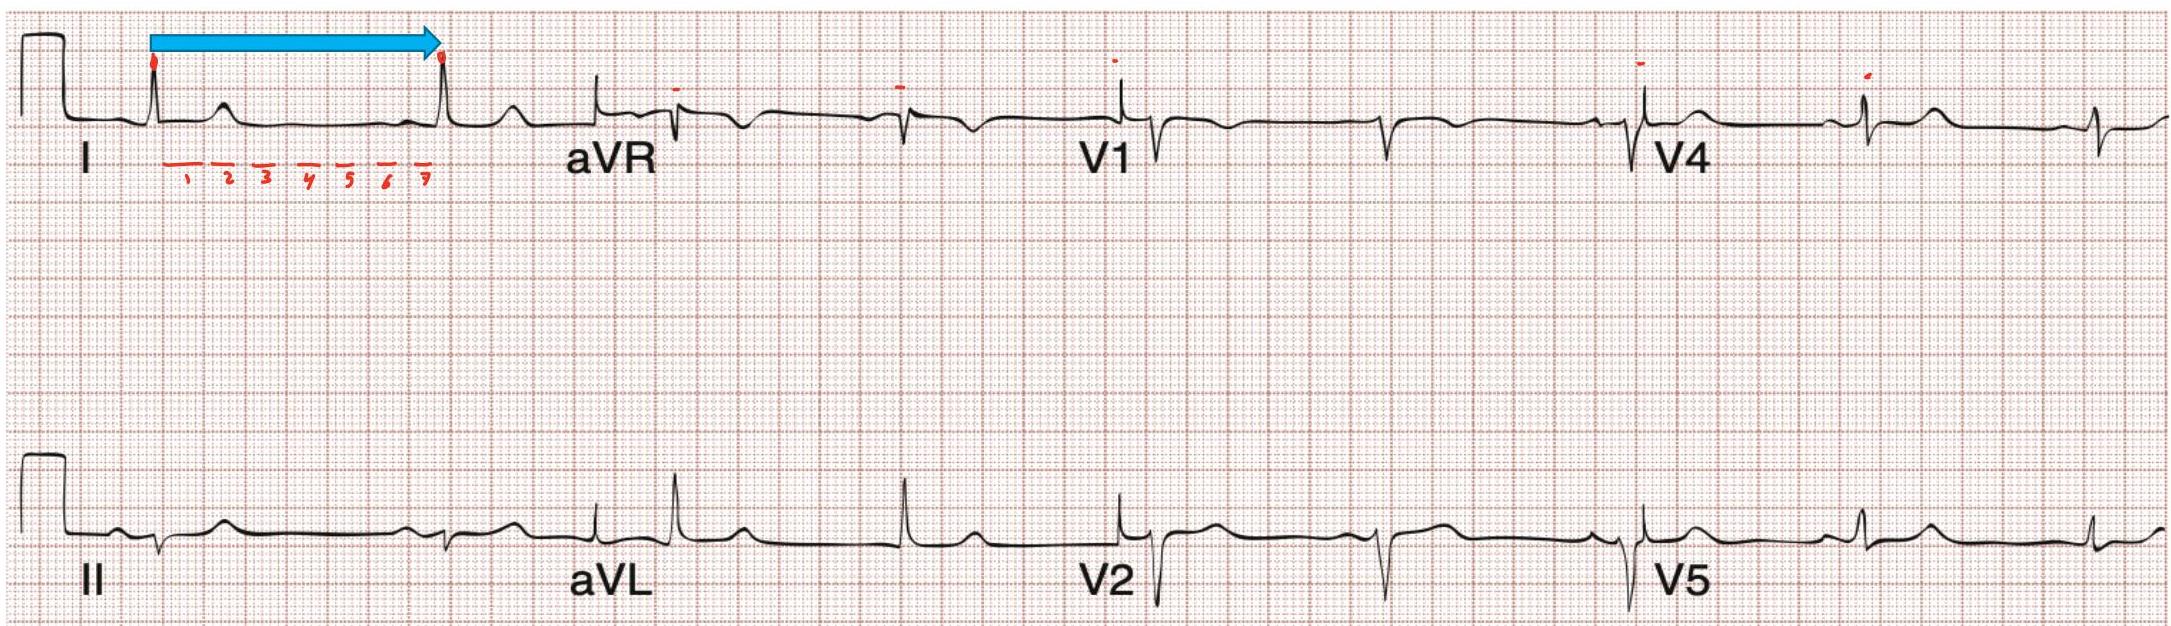
1. Rate
Calculation Methods
Regular Rhythm: OR (More precise)

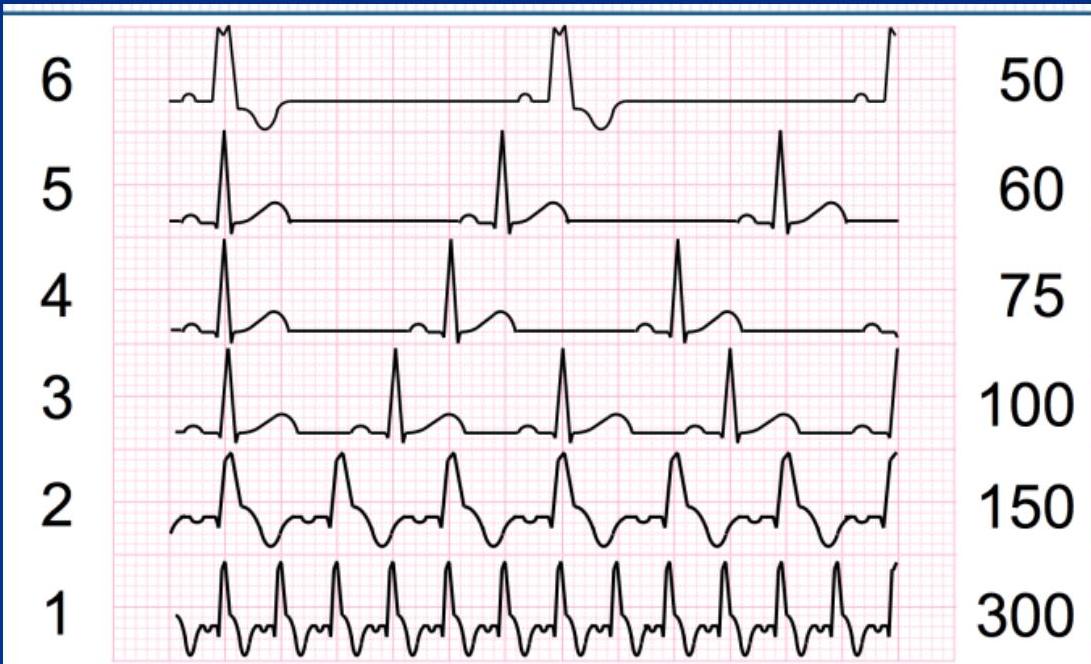
Irregular Rhythm: Count R waves in 10 seconds (entire strip usually) and multiply by 6.
Definitions
- Sinus Bradycardia: HR < 60 bpm.
- Sinus Tachycardia: HR > 100 bpm (usually < 150 bpm).
2. Rhythm
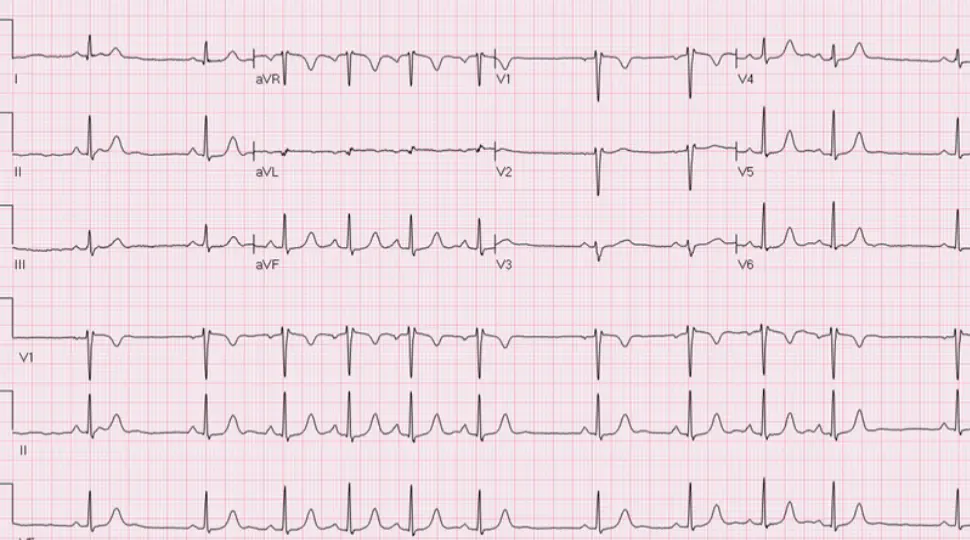
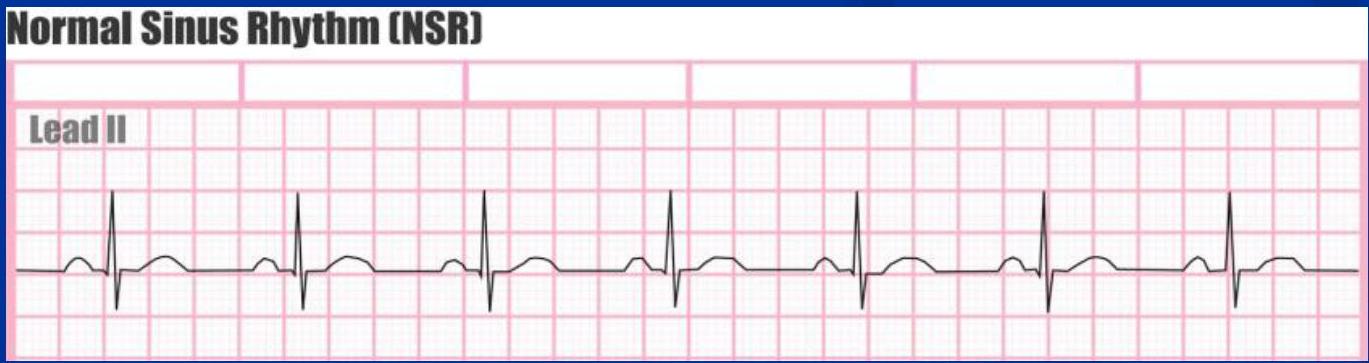
Normal Sinus Rhythm (NSR)
- Electrical signal originates from the SA node.
- Rate: 60-100 bpm.
- Regularity: R-R intervals are constant.
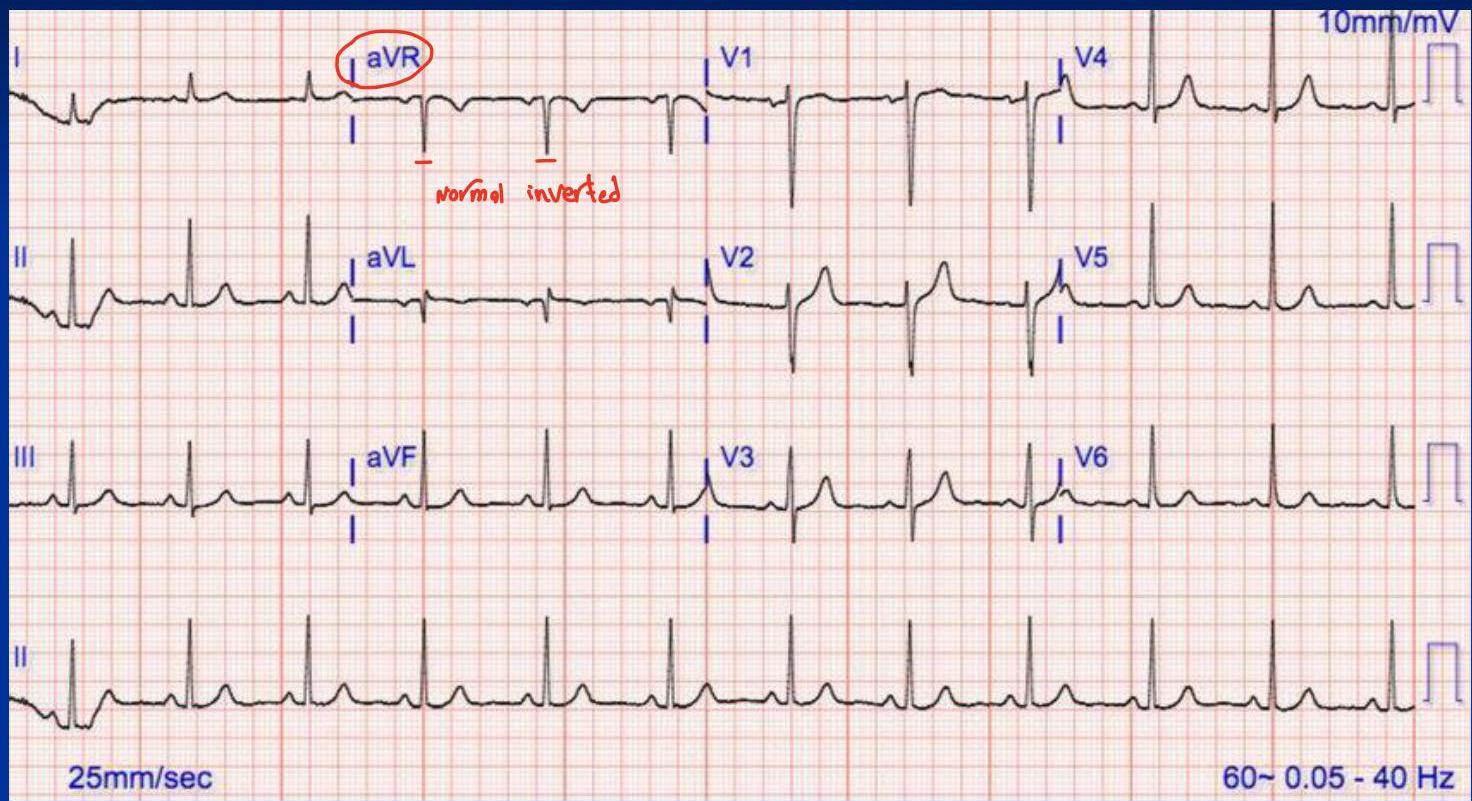
- P Waves:
- Upright in all leads (except aVR).
- Consistent shape.
- Every P wave is followed by a QRS complex.
- PR Interval: Constant.
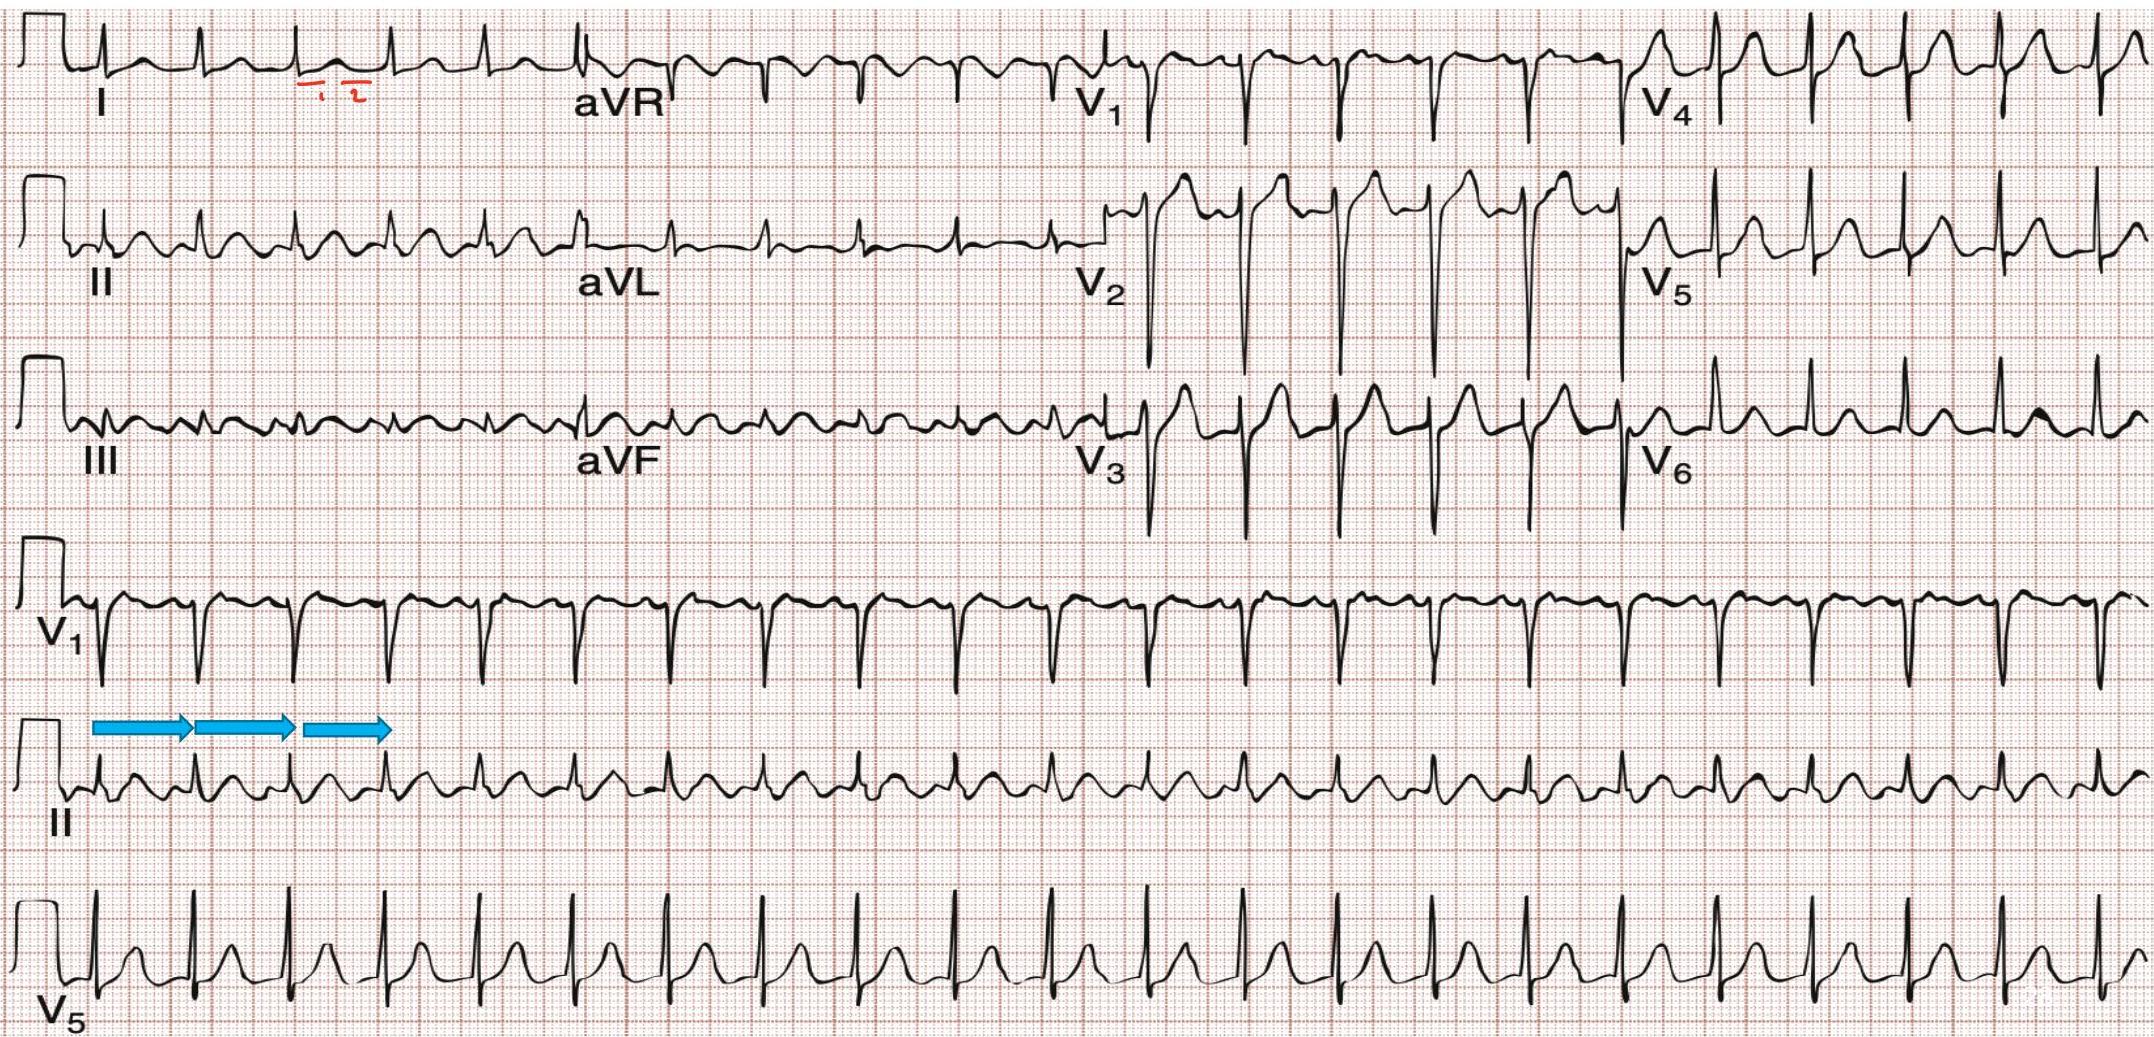
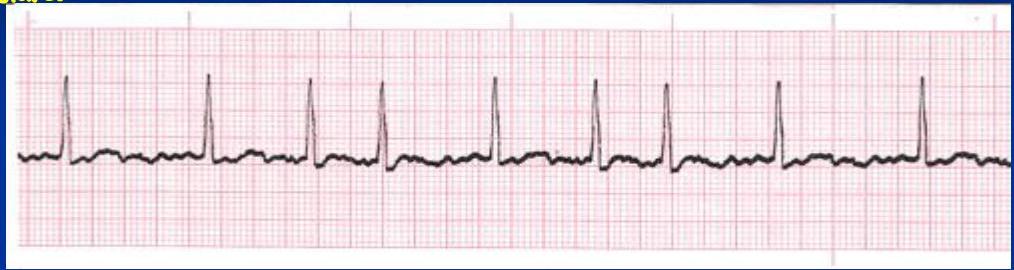
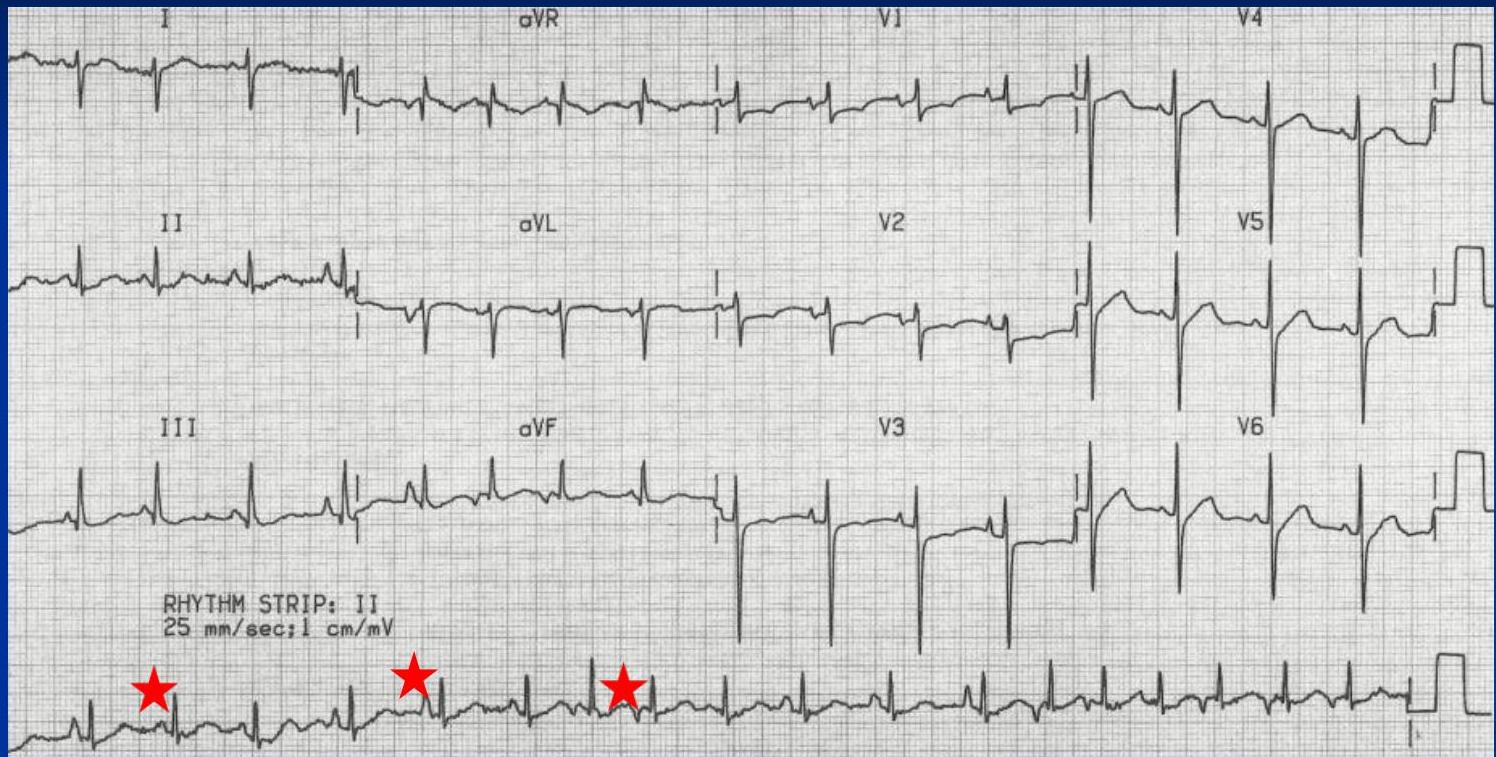
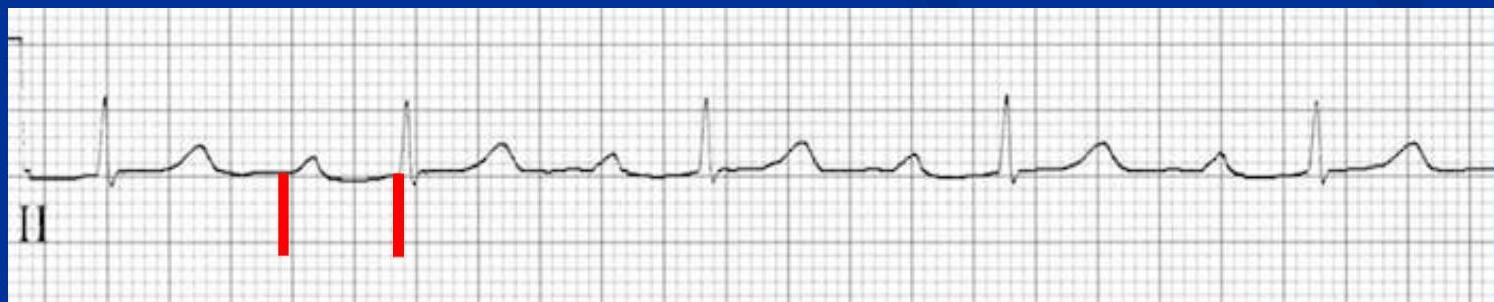
 irregular yet sinus rhythm
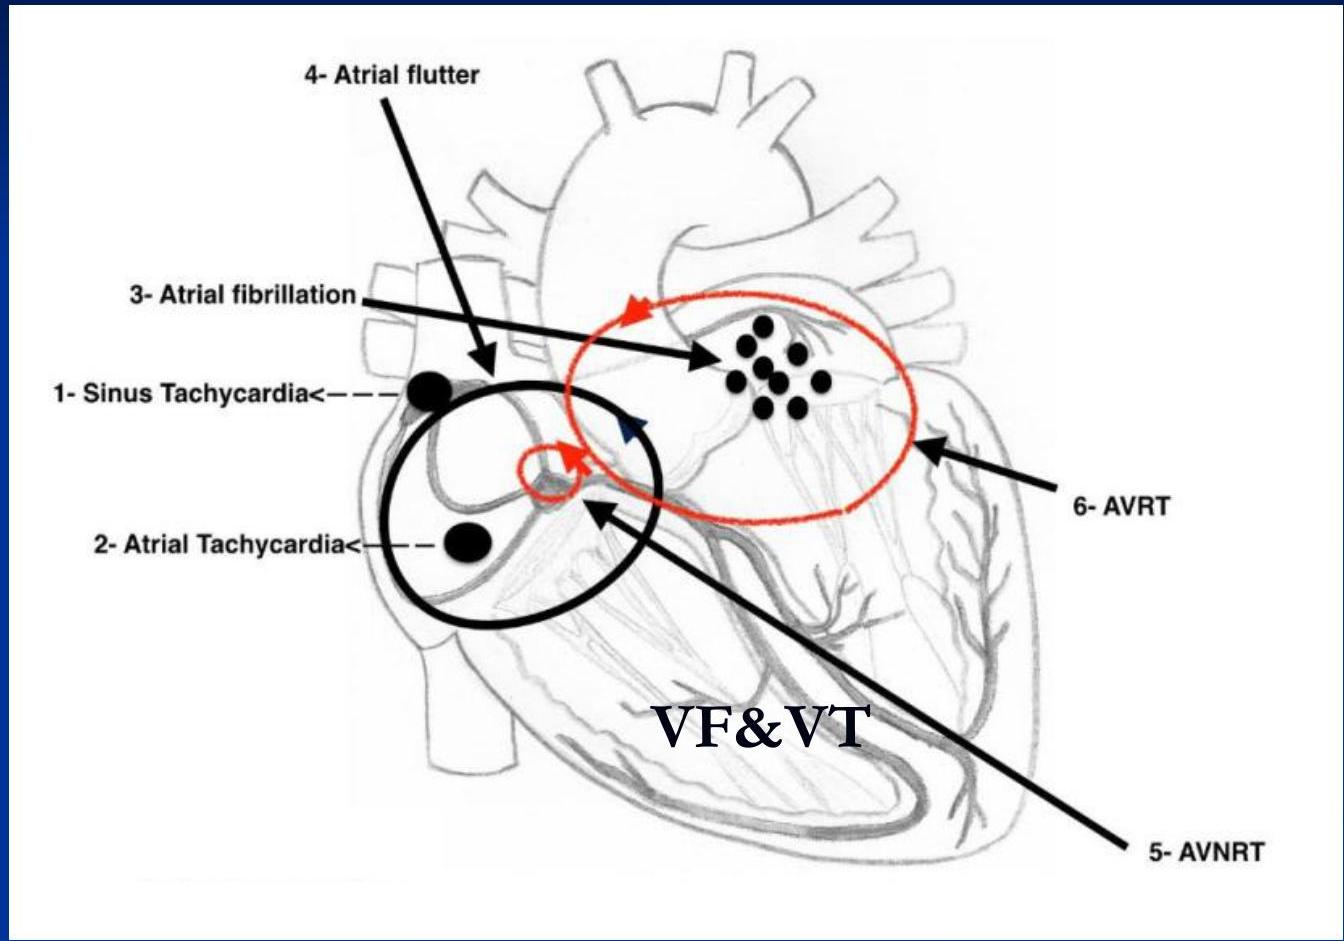
Non-Sinus Rhythms
Impulse originates from outside the SA node.
Supraventricular (Above Ventricles):
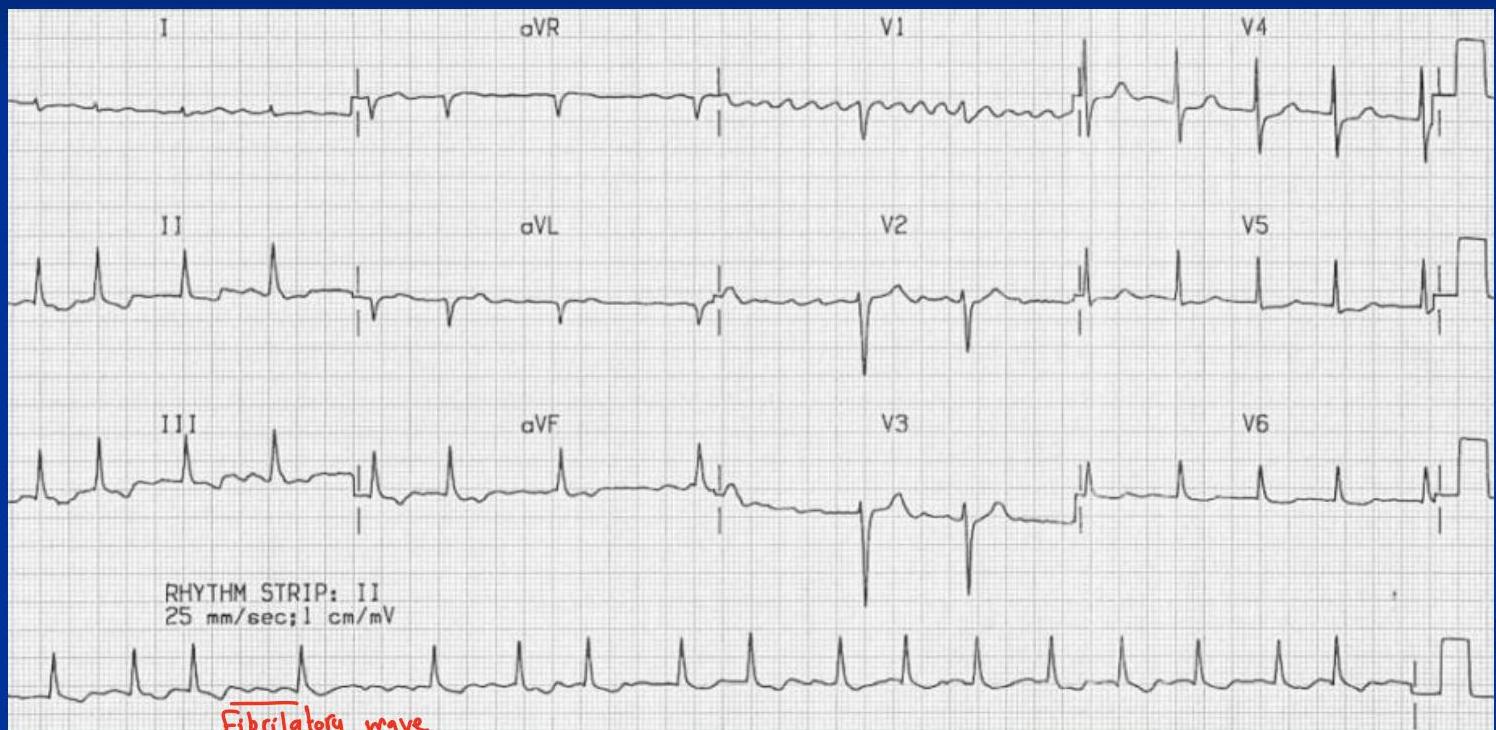
- Atrial Fibrillation (AF): Irregularly irregular, no distinct P waves.
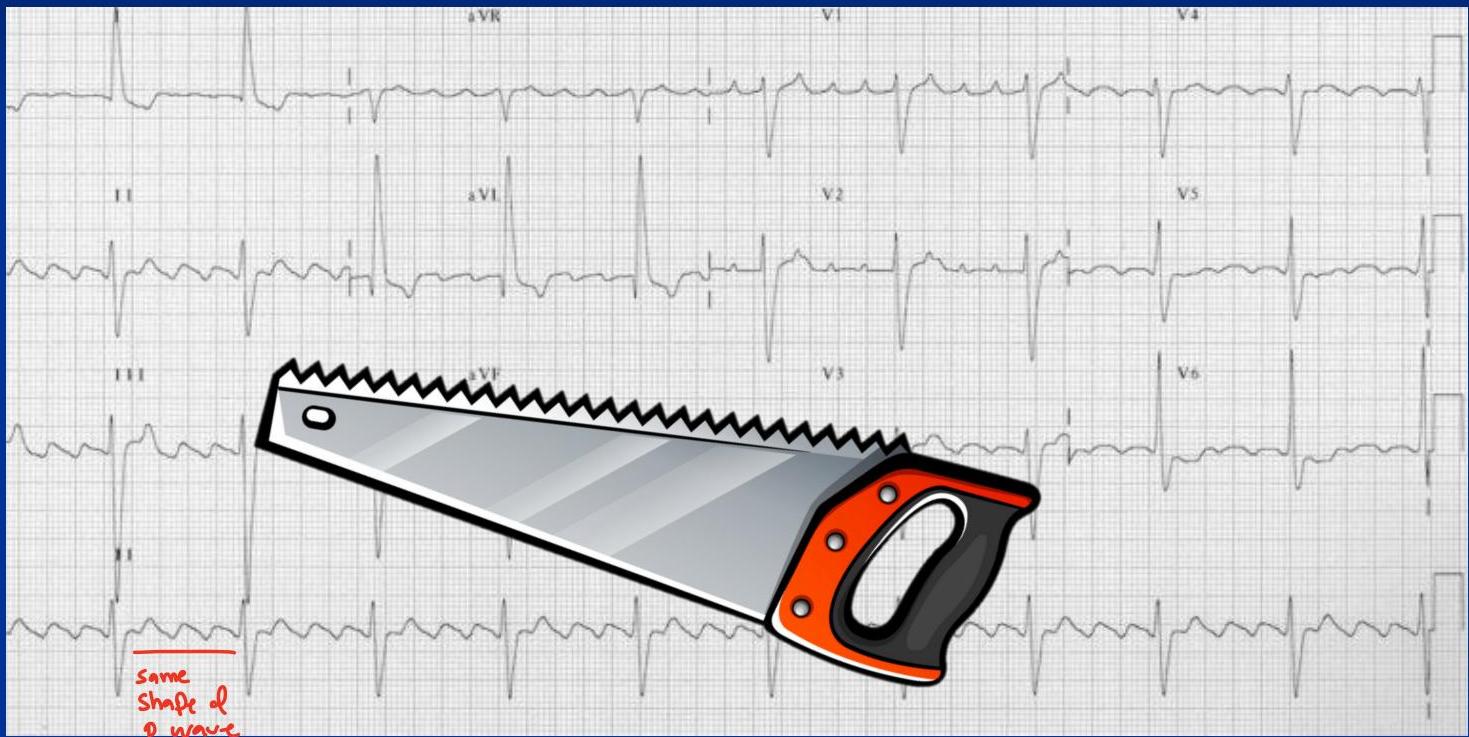
- Atrial Flutter: Sawtooth pattern, can be regular or irregular.
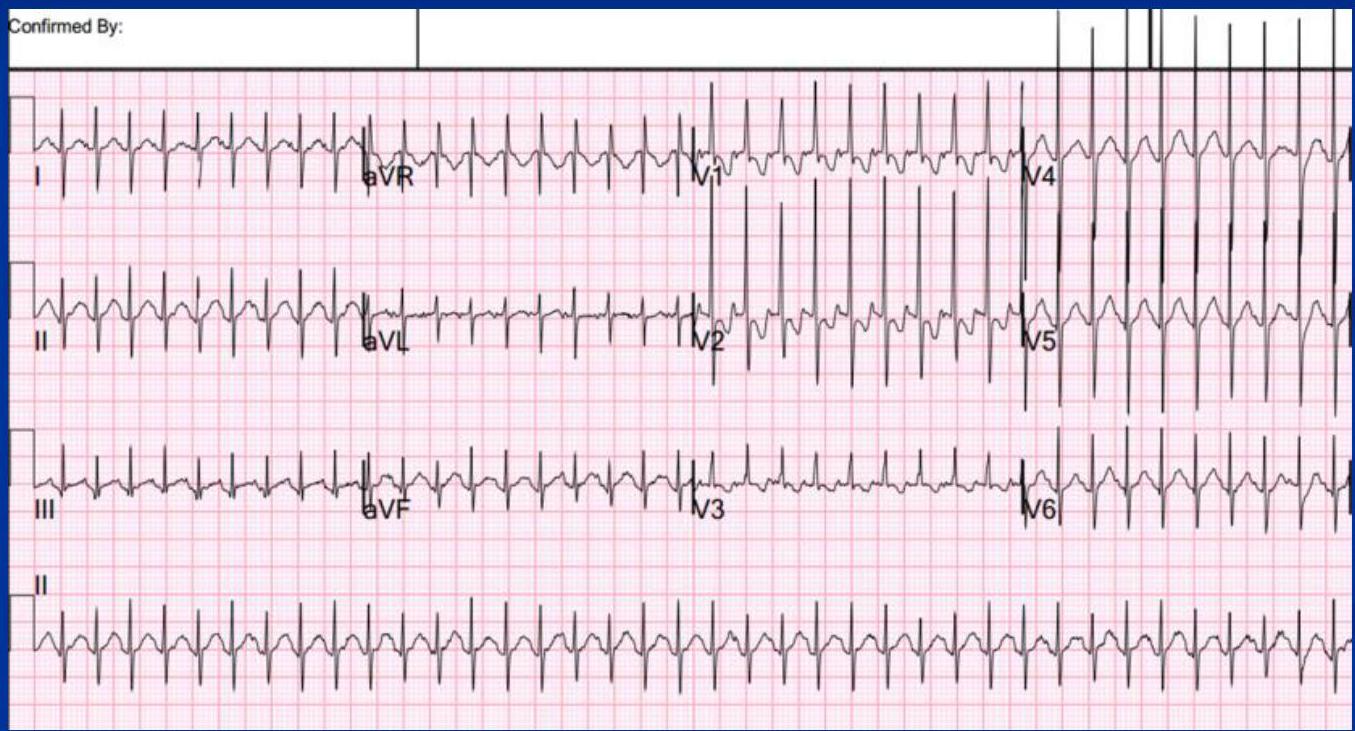
- Paroxysmal Supraventricular Tachycardia (PSVT): Regular, narrow QRS, rate > 170 bpm, P waves often buried. - given enhanced valsalva maneuver and adenosine (to young and healthy) ⇒ ablation (cut conduction fibers)
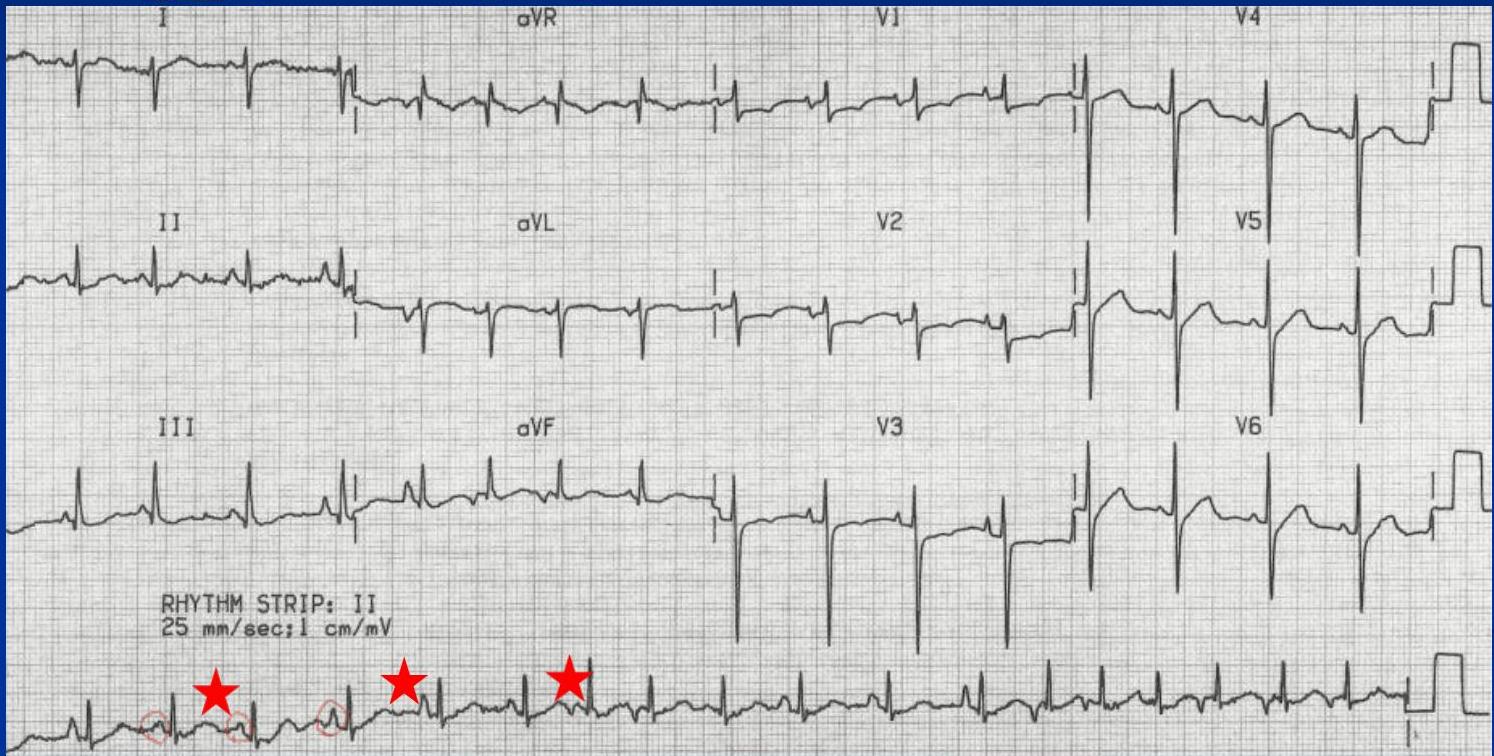
- Multifocal Atrial Tachycardia (MAT): Irregular, P waves have at least 3 different shapes.
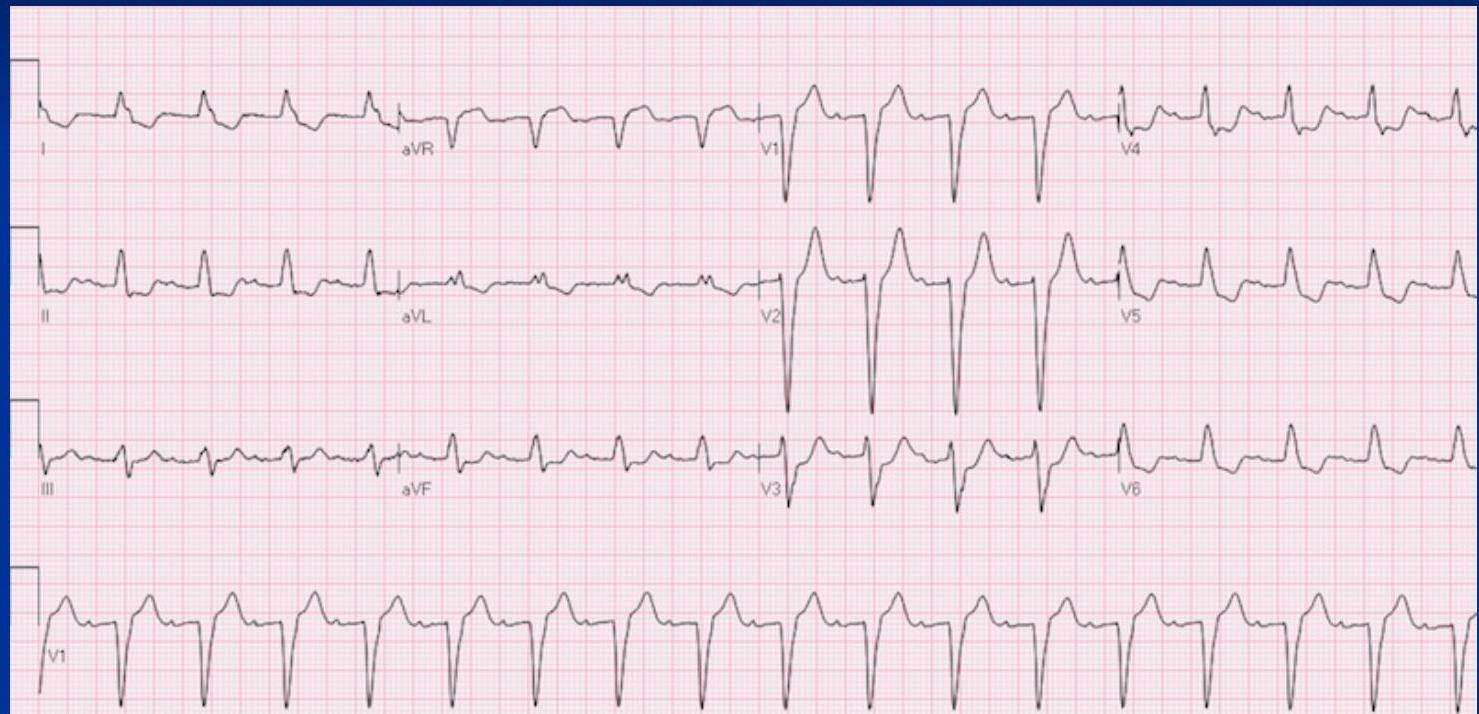
Ventricular:
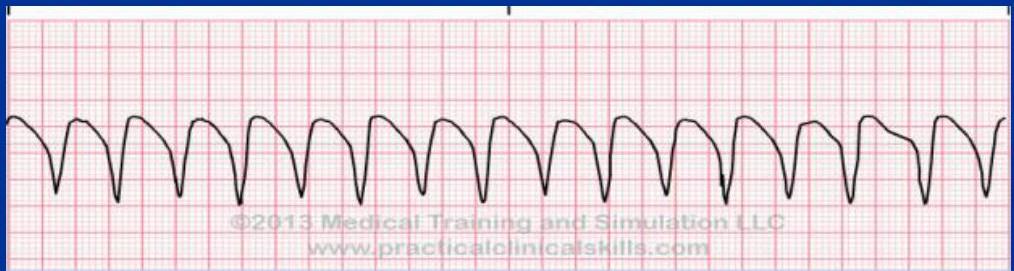
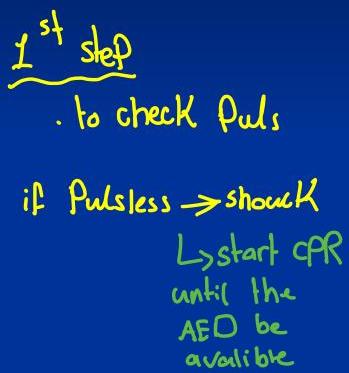
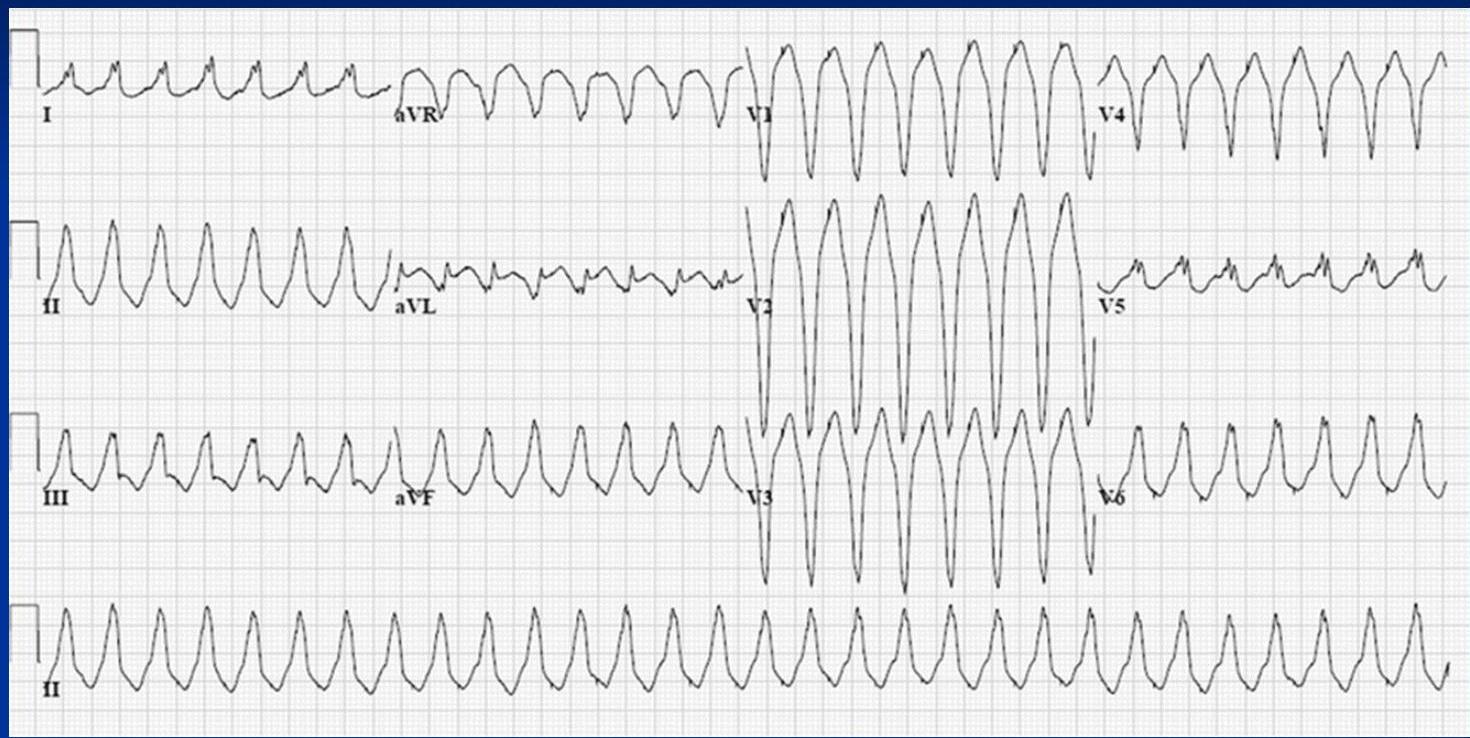
- Ventricular Tachycardia (VT): Regular, wide QRS, no P wave associated, rate > 120 bpm.
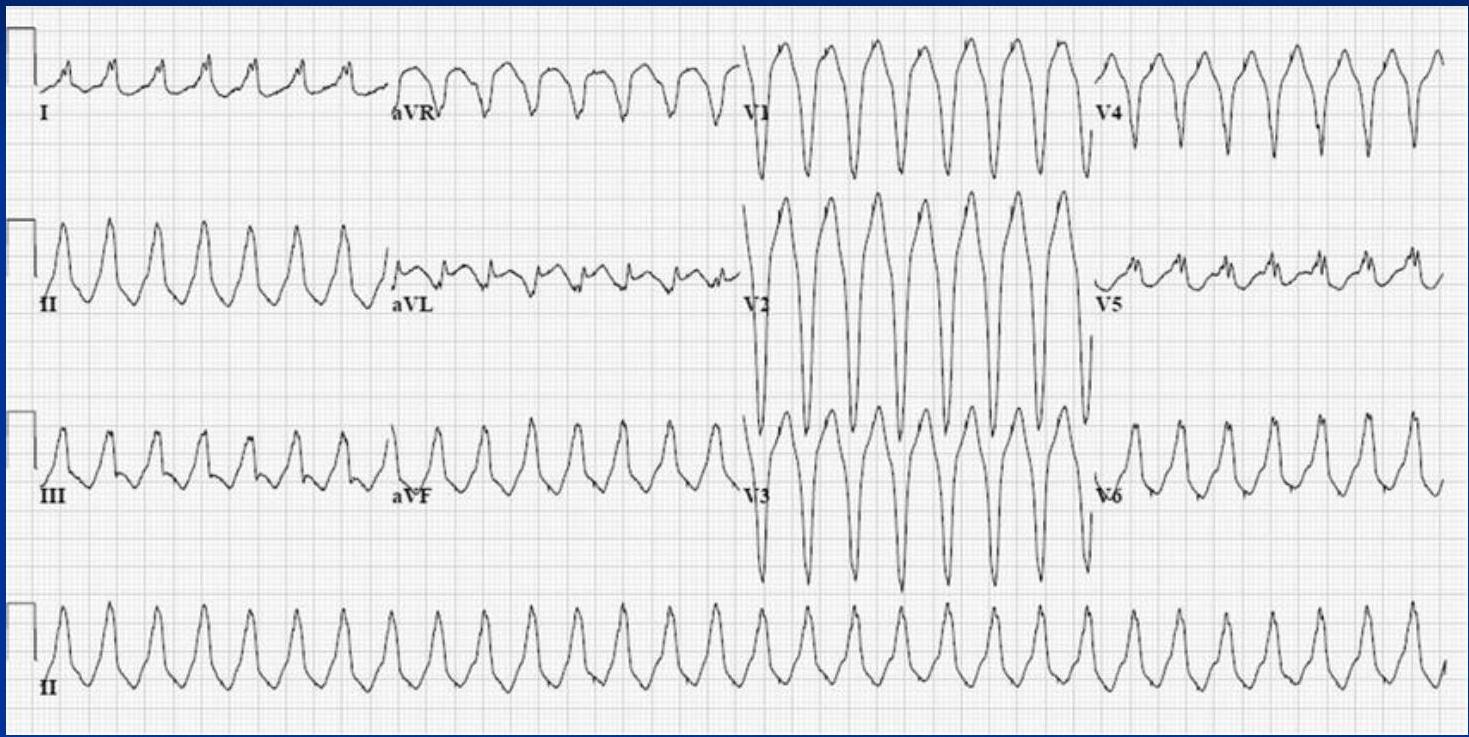
- Ventricular Fibrillation (VF): Chaotic activity, coarse or fine. Cardiac Arrest Rhythm - First check if there is pulse - if not ⇒ Defibrillate!
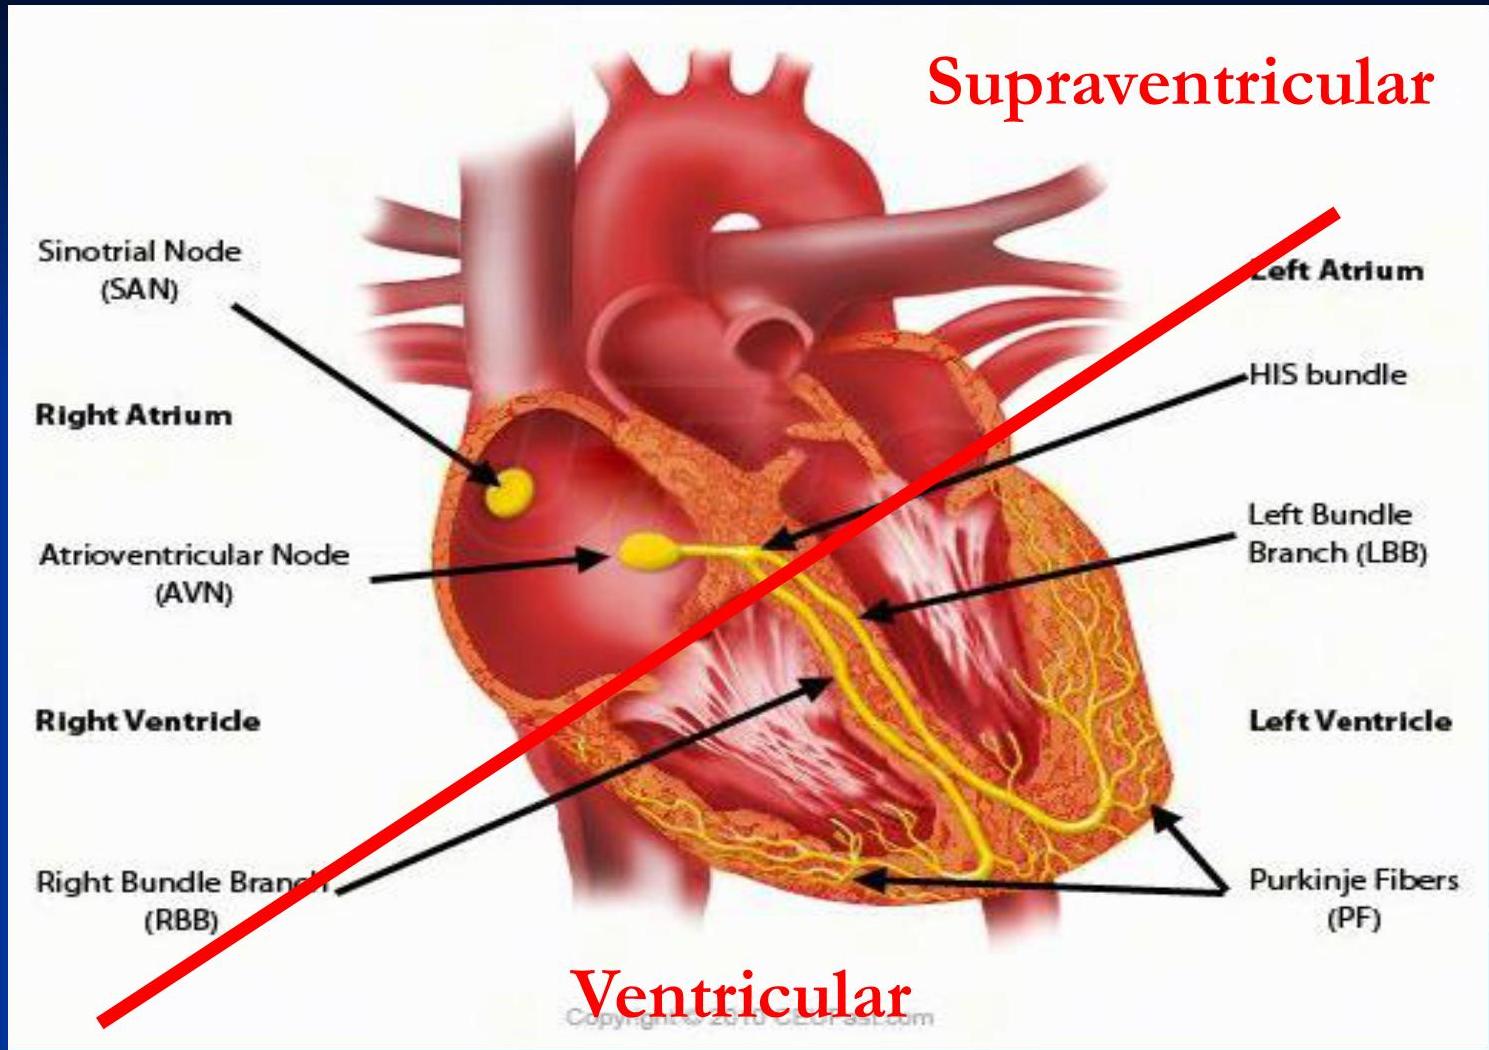 supra = narrow complex
ventricular = wide complex
supra = narrow complex
ventricular = wide complex
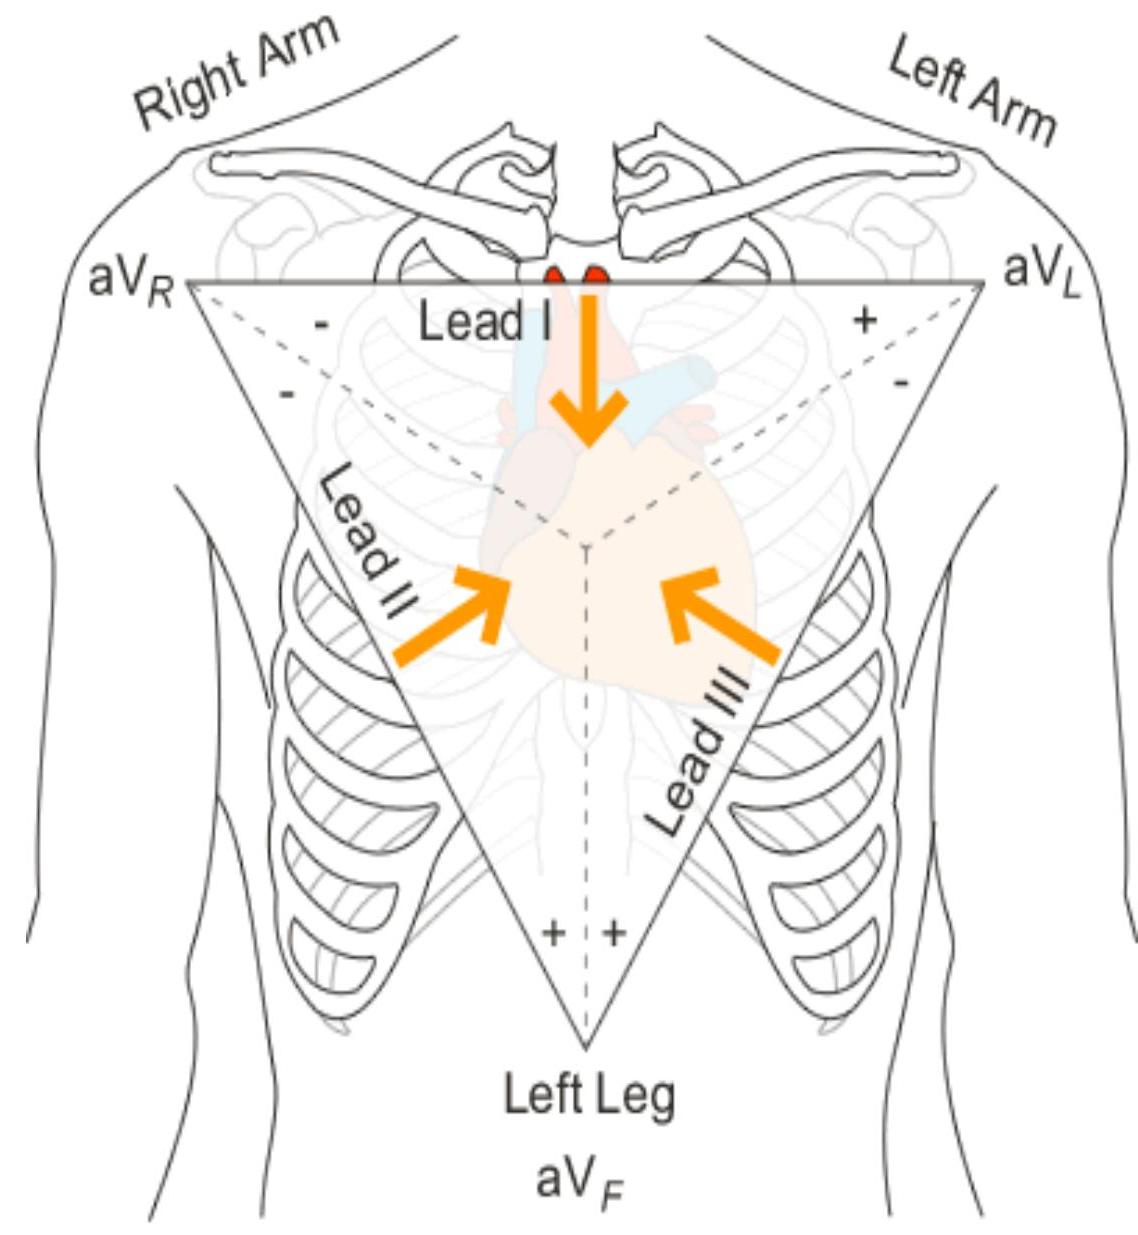
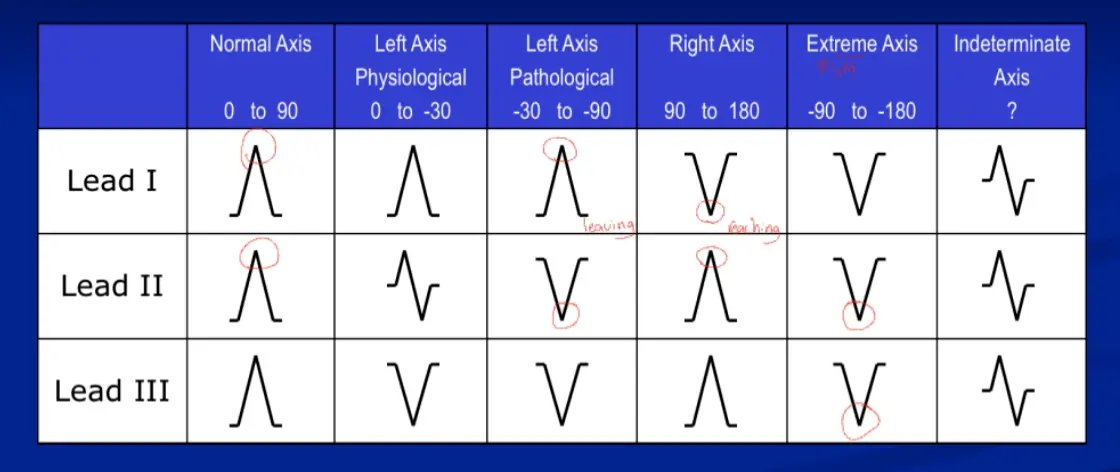
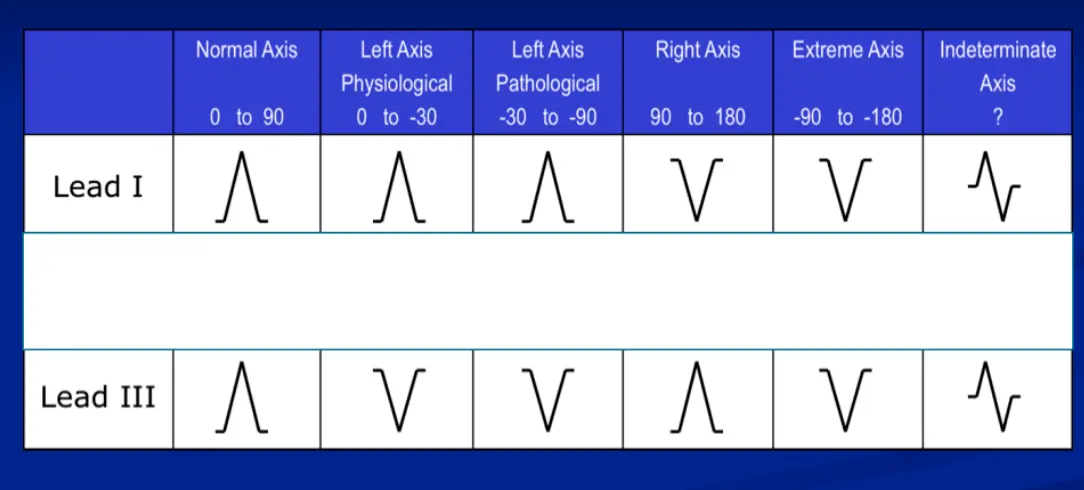
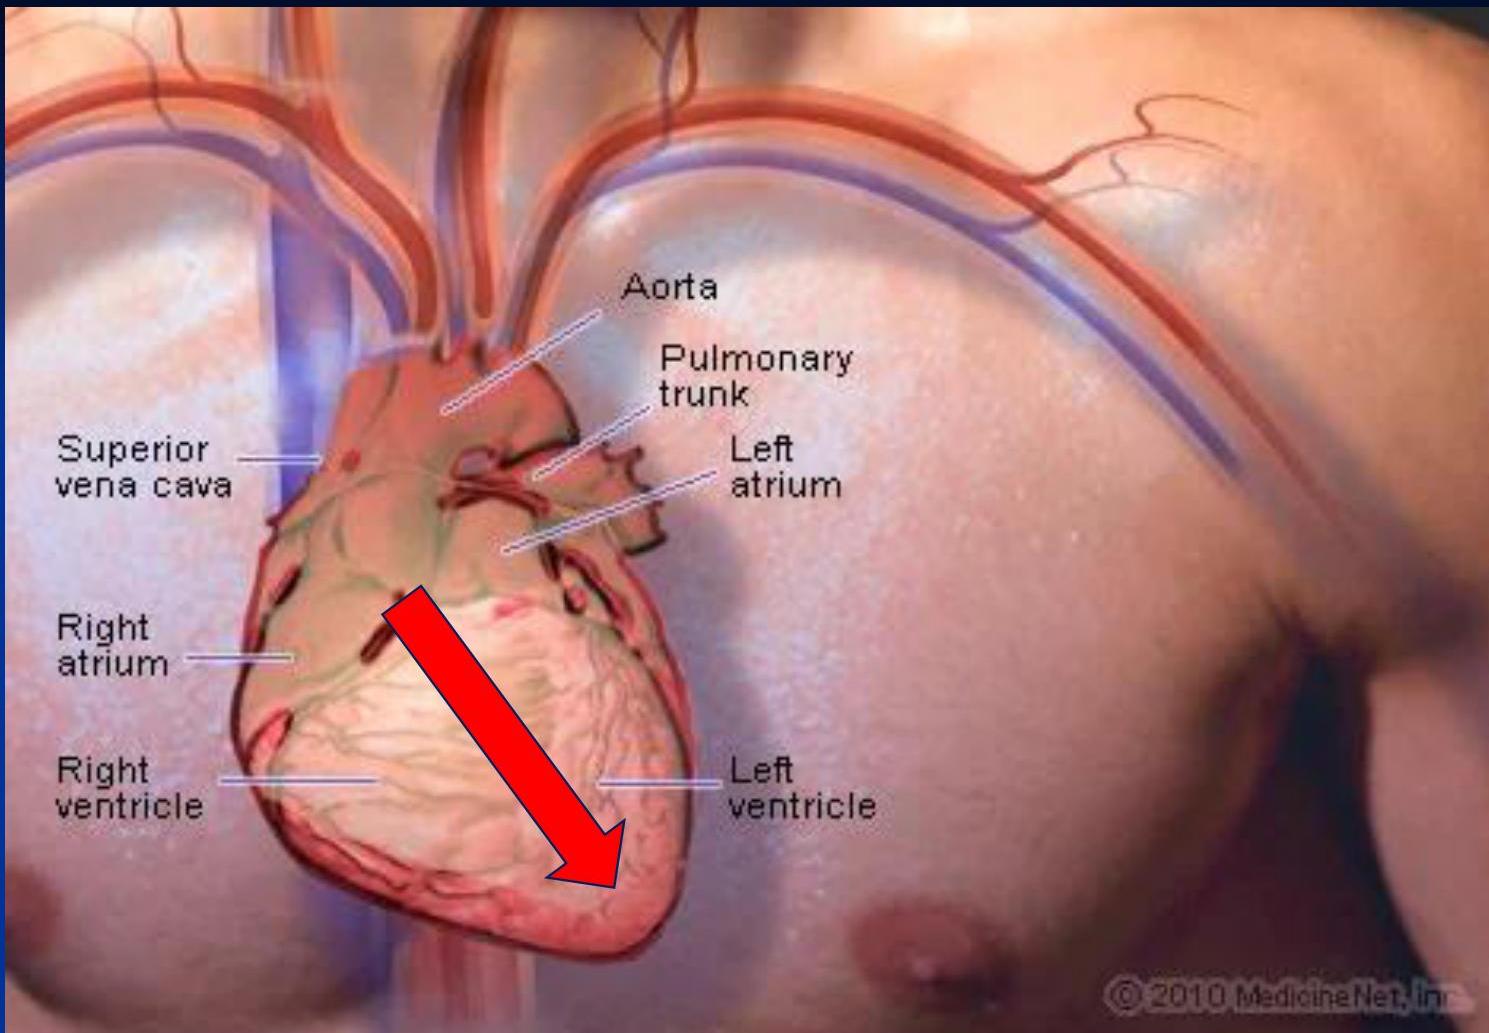
3. Axis Assessment
It’s the direction of the action potentials traveling through the ventricles during ventricular activation (depolarization). The QRS complex, which represents ventricular depolarization, is used for the determination of the electrical heart axis
Direction of action potentials during ventricular depolarization.
Look at Lead I and aVF.
| Axis | Lead I | aVF | Notes |
|---|---|---|---|
| Normal | (Pos) | (Pos) | 0° to +90° |
| Left Axis (LAD) | (Pos) | (Neg) | 0° to -90° (Physiological up to -30°) |
| Right Axis (RAD) | (Neg) | (Pos) | +90° to +180° (Reaching towards each other) |
| Extreme/Northwest | (Neg) | (Neg) | -90° to -180° |
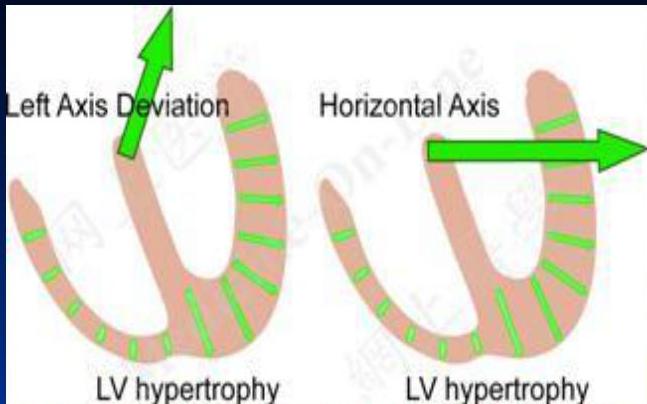
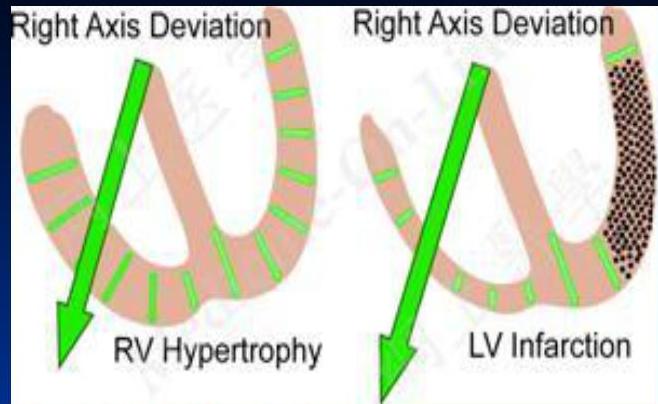
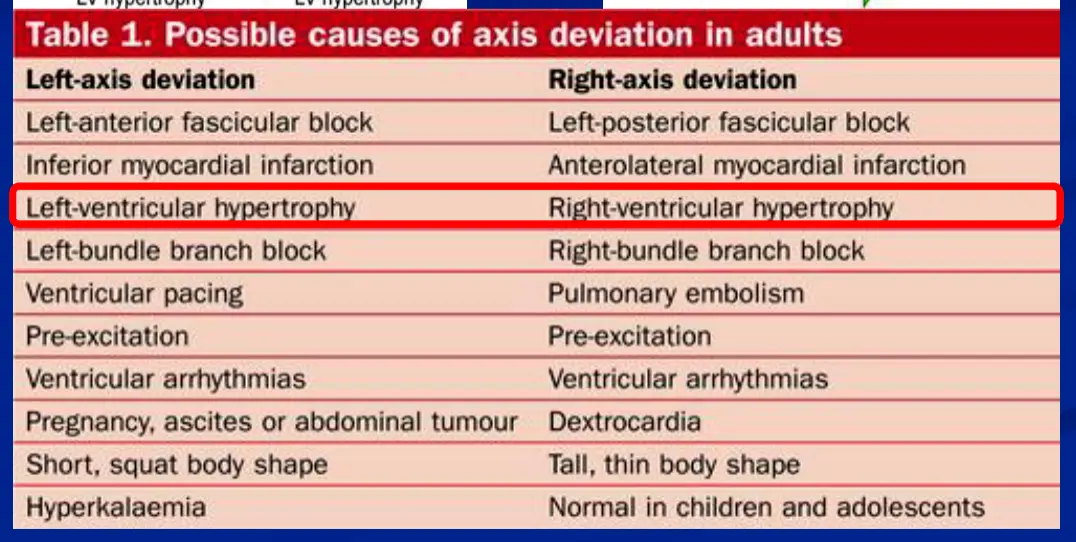
Causes of Axis Deviation:
4. P Wave
Normal P Wave:
- Shape: Upright in all leads, inverted in aVR.
- Amplitude: < 2.5 mm (0.25 mv).
- Duration: < 0.12 sec (3 small squares).
Abnormalities:
- Atrial Fibrillation: No distinct P waves.
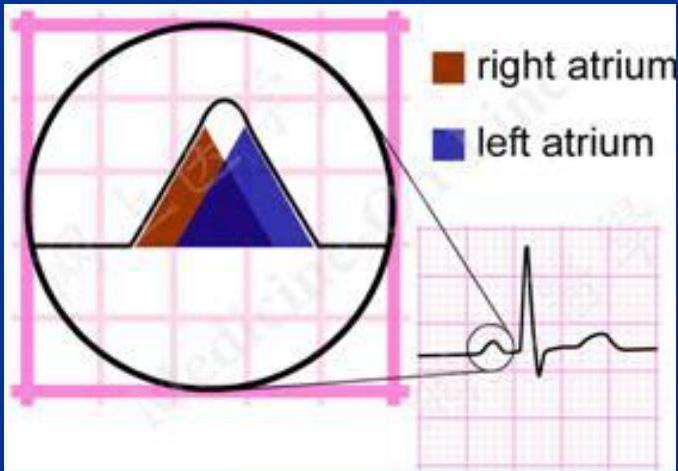
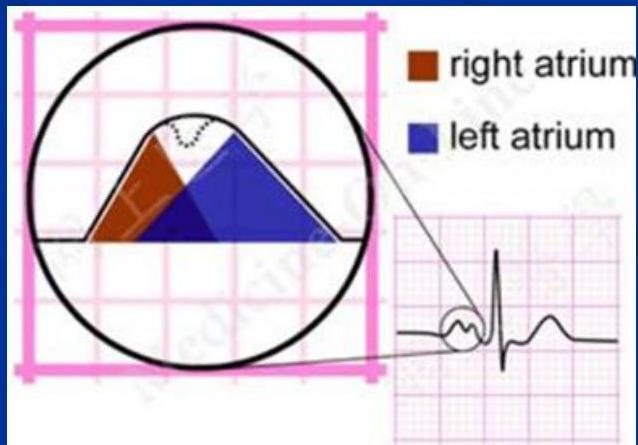
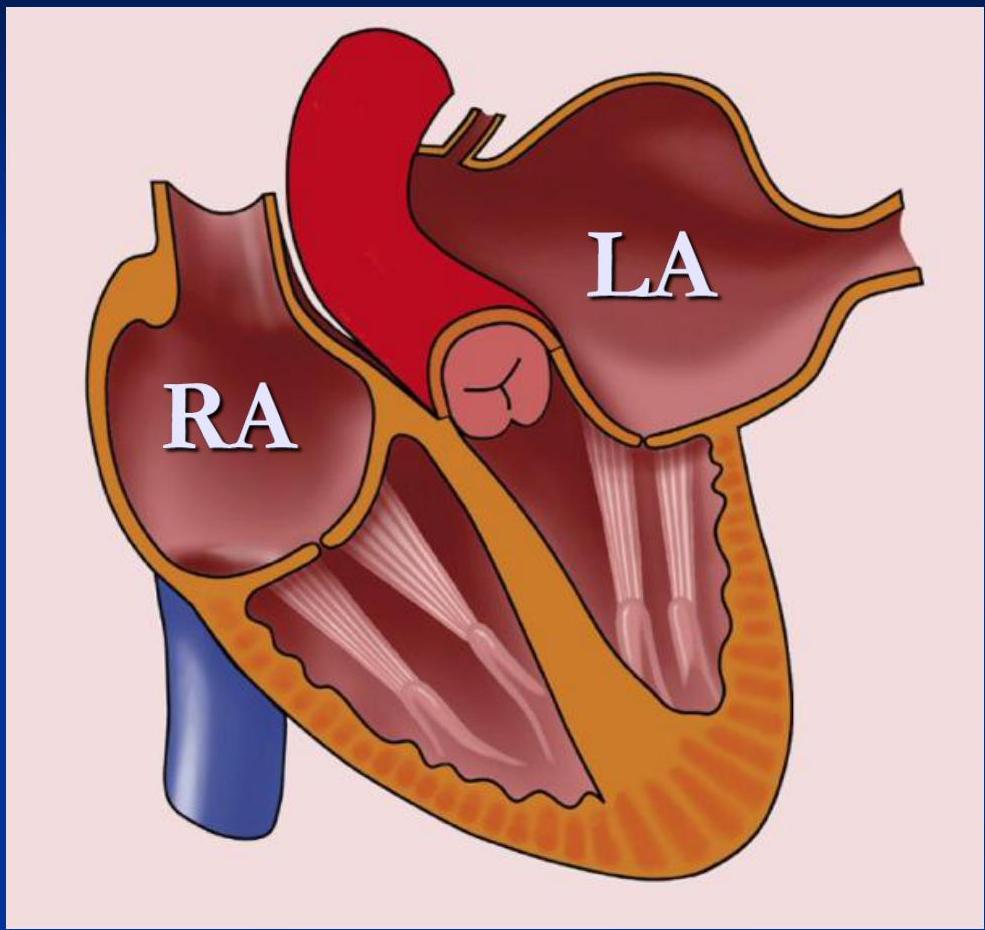
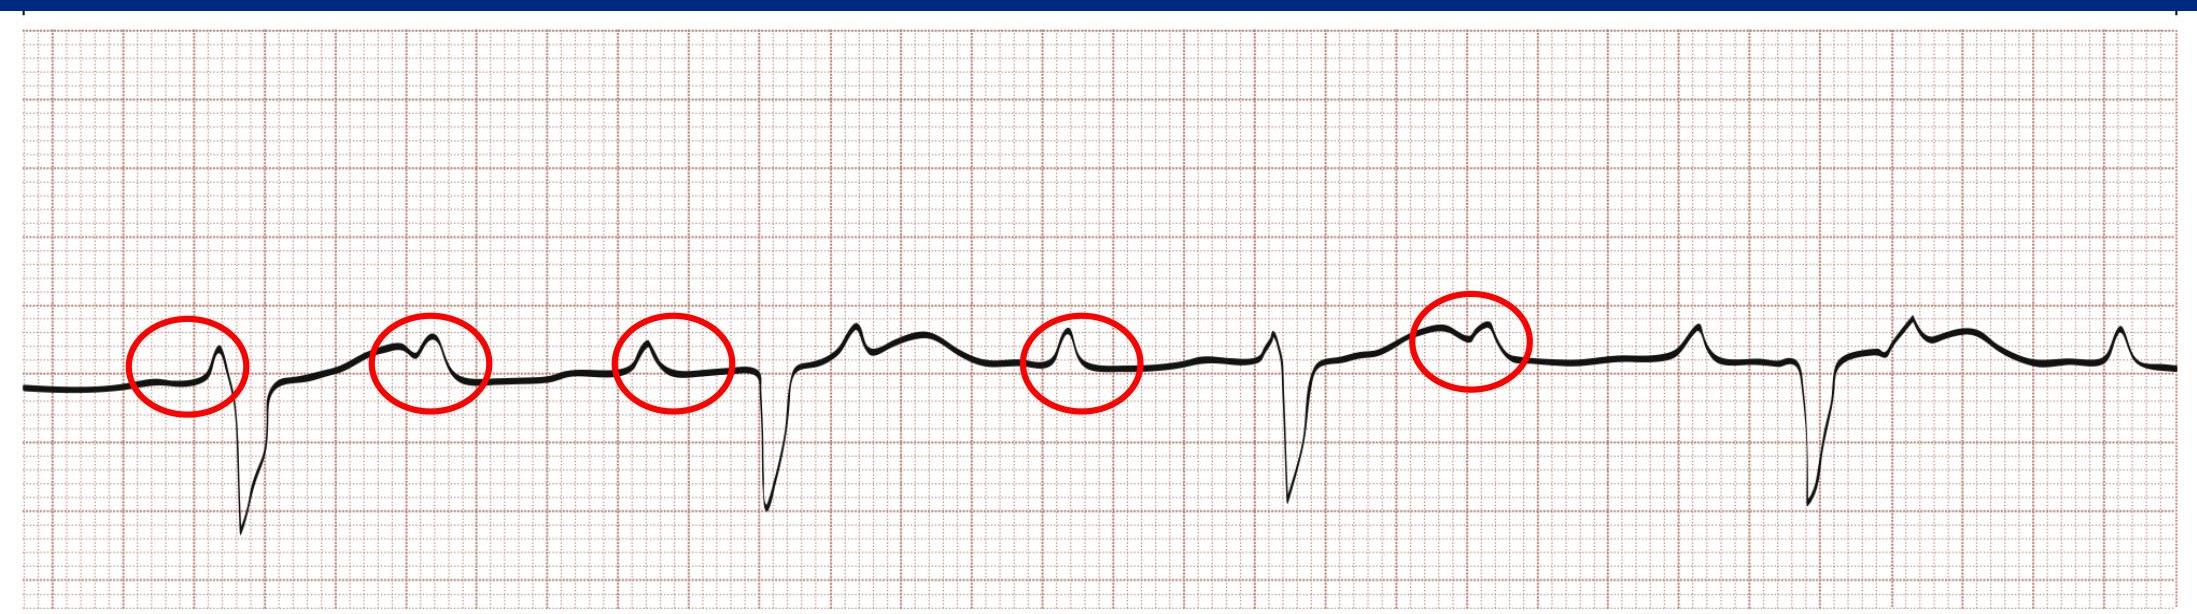
- Right Atrial Enlargement (P-Pulmonale): Peaked P wave (> 2.5 mm in inferior leads). ■ > 2.5 mm in the inferior leads (II, III and AVF) ■ > 1.5 mm in V1 and V2
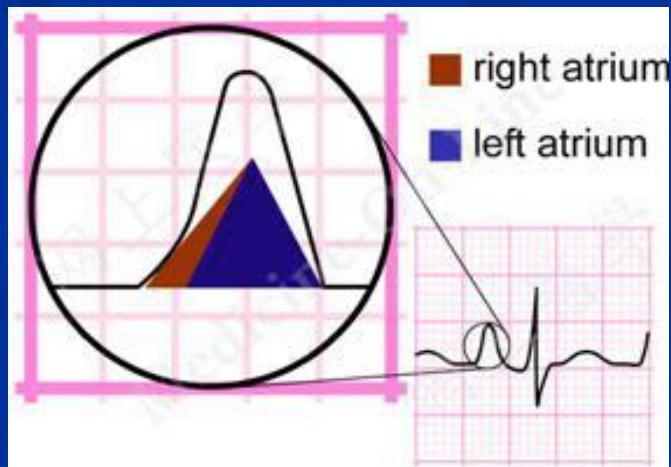
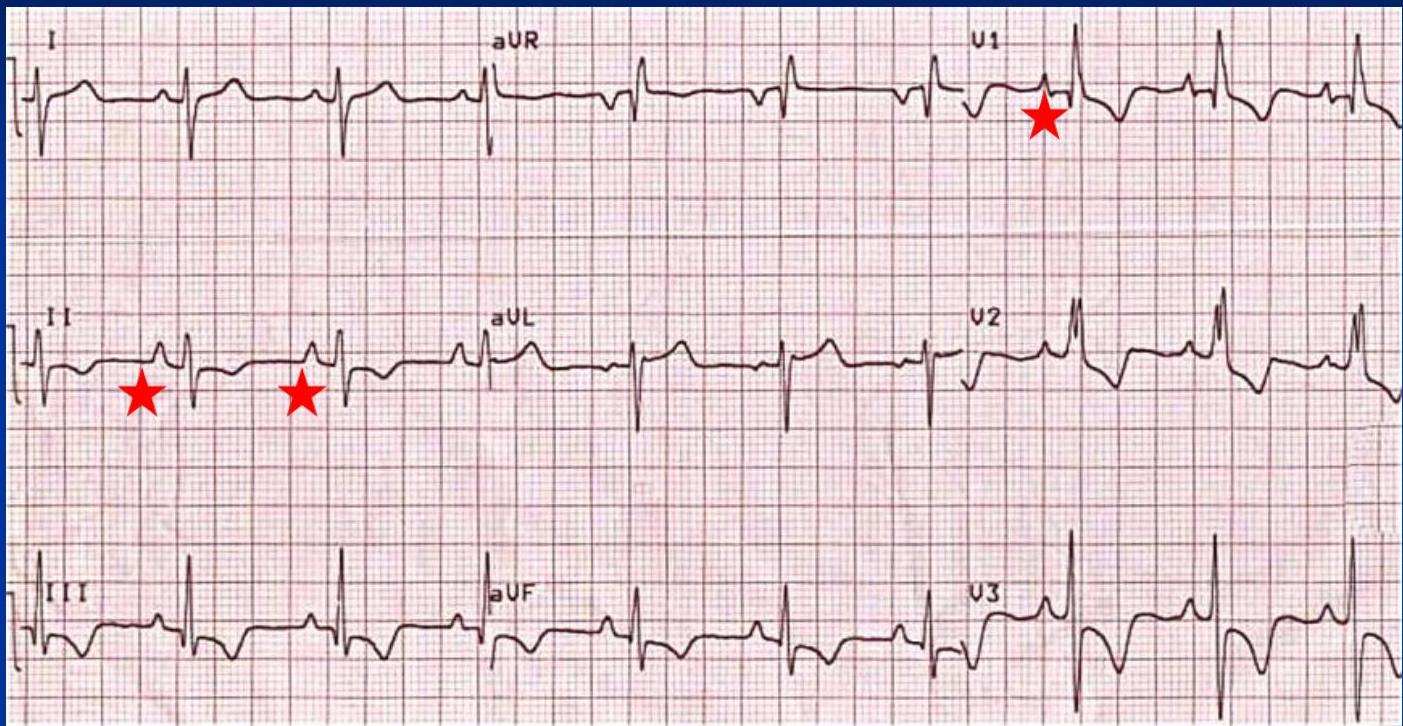
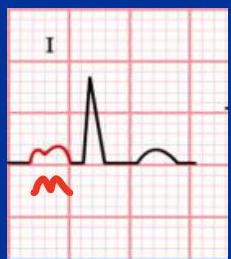
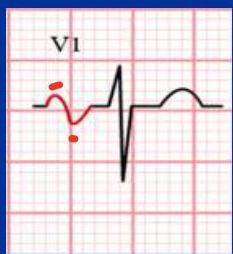
- Left Atrial Enlargement (P-Mitrale): Classically seen with mitral stenosis (P-mitrale) ▪ Prolonged duration ▪ M shape P in inferior leads ▪ Biphasic P in V
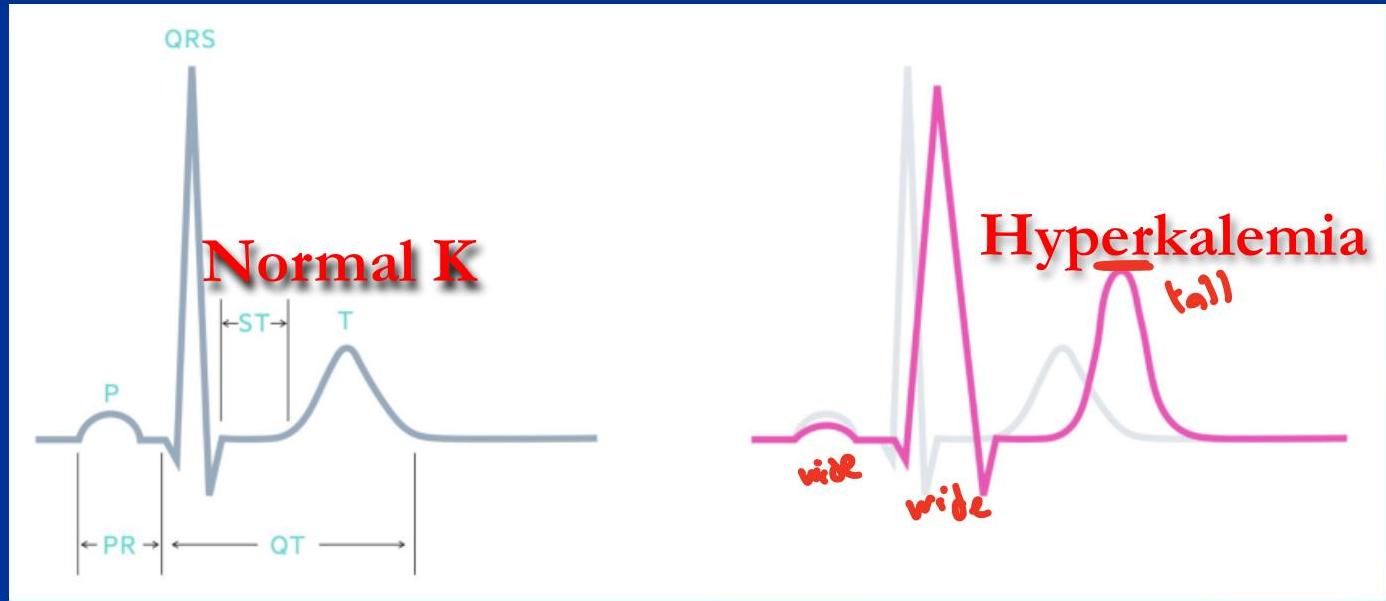
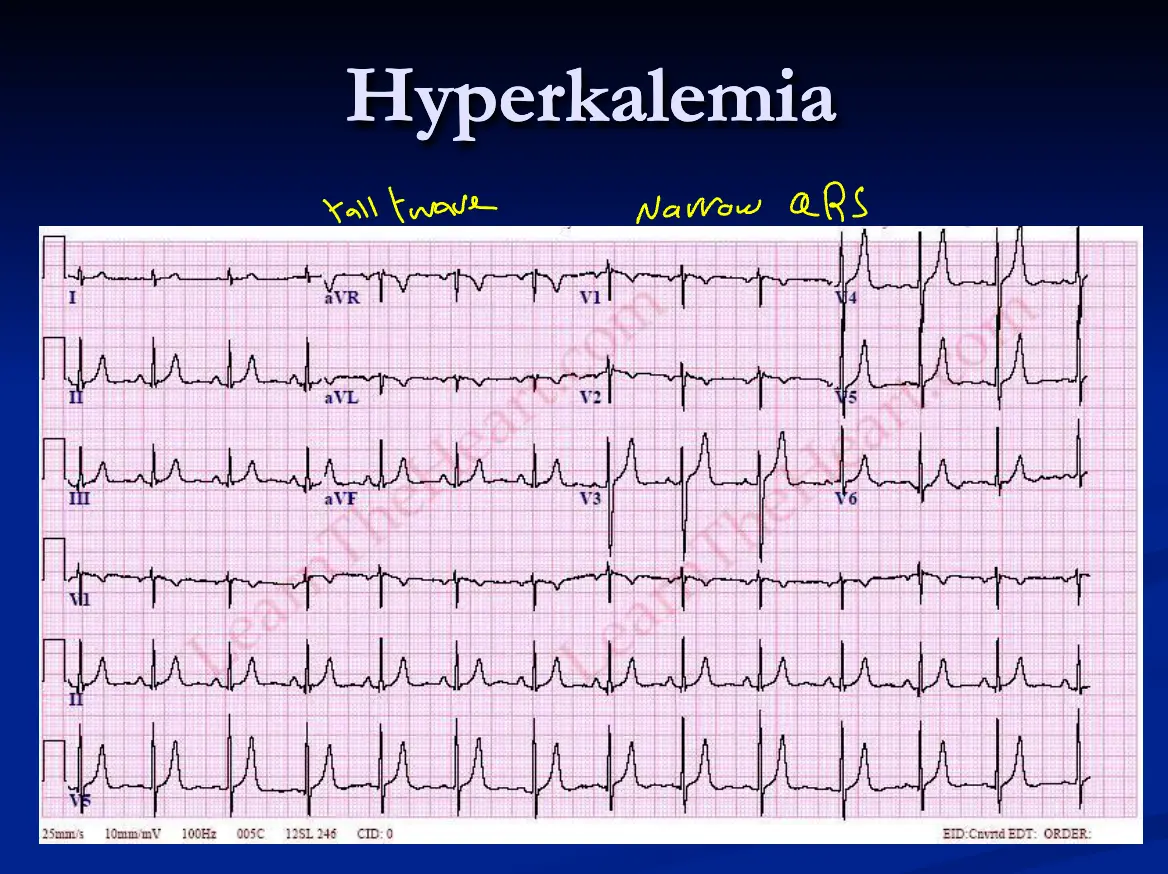
- Hyperkalemia: Low voltage or flat P wave.
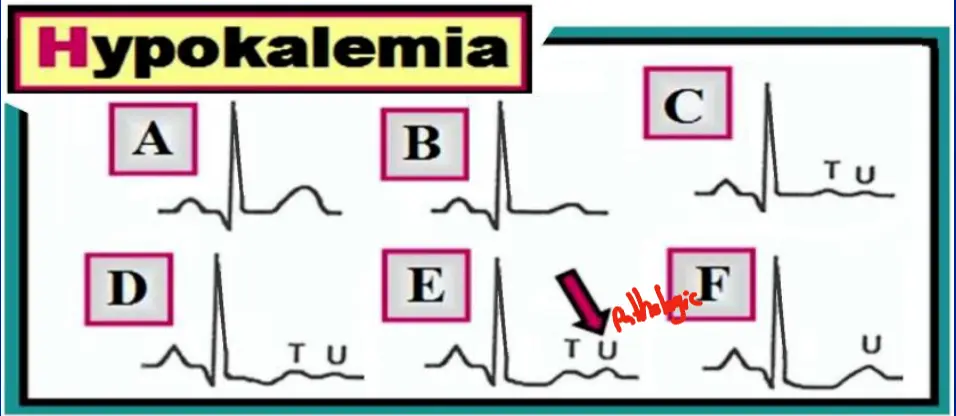
- Hypokalemia: Prominent P wave.
Additional examples: Multi focal Atrial Tachycardia
Atrial enlargement
5. PR Interval
Represents delay at the AV node. Normal: Normal PR interval 3-5 small squares
Prolonged PR Interval (more than 5 small squares /. > 0.20 sec)
Heart Blocks:
- 1st Degree AV Block: Fixed prolongation (> 5 small squares). Consistent. ■ Heart blocks are when there is significant delay or blockage in transmitting the signal from the atria to the ventricles. This is usually associated with a junctional or ventricular escape rhythm. ■ First degree AV block is generally “no big deal” and common in older age and with beta-blockers. The PR interval is consistently >200ms i.e. more than one big square between P & Q
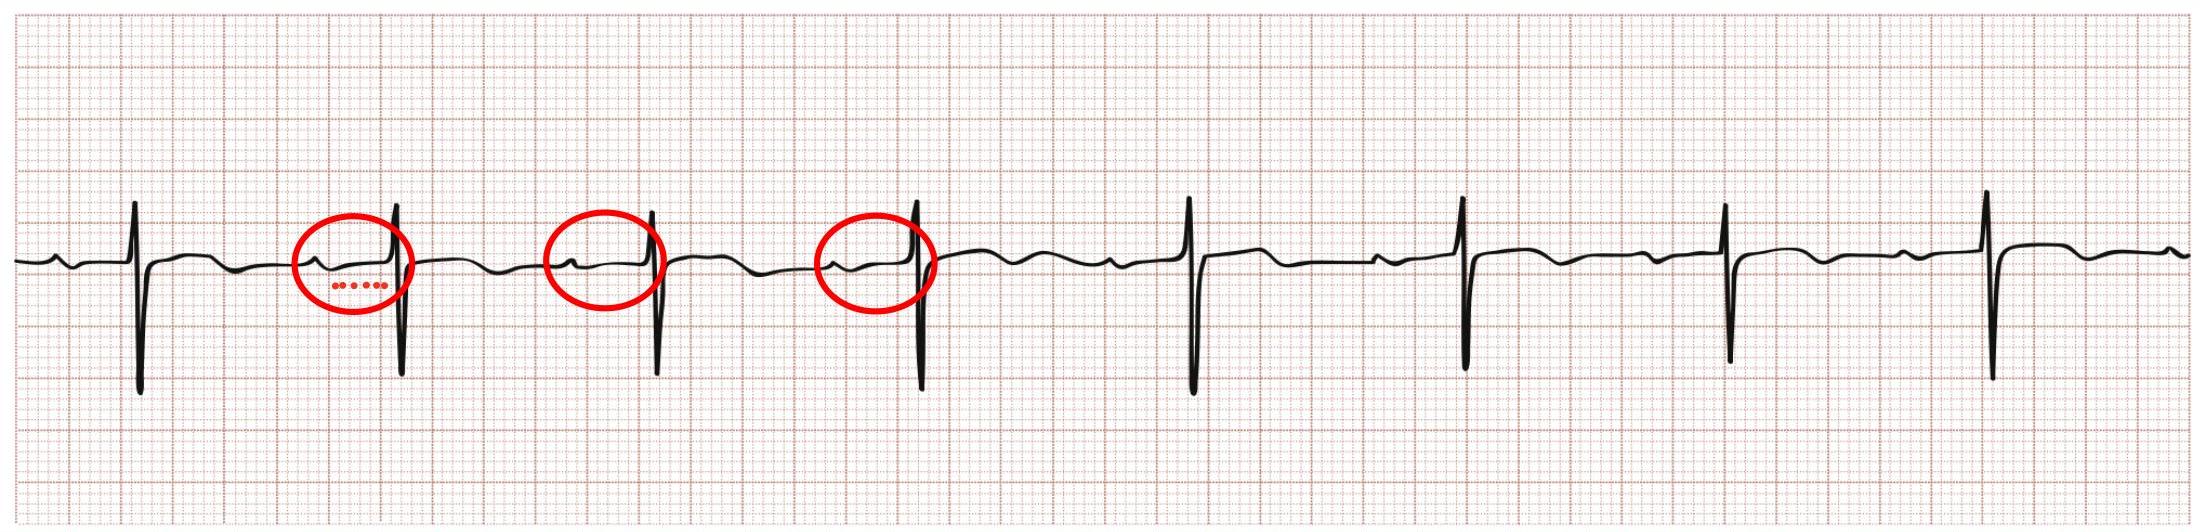
- 2nd Degree AV Block Type 1 (Wenckebach): Progressive lengthening of PR until a QRS is dropped.
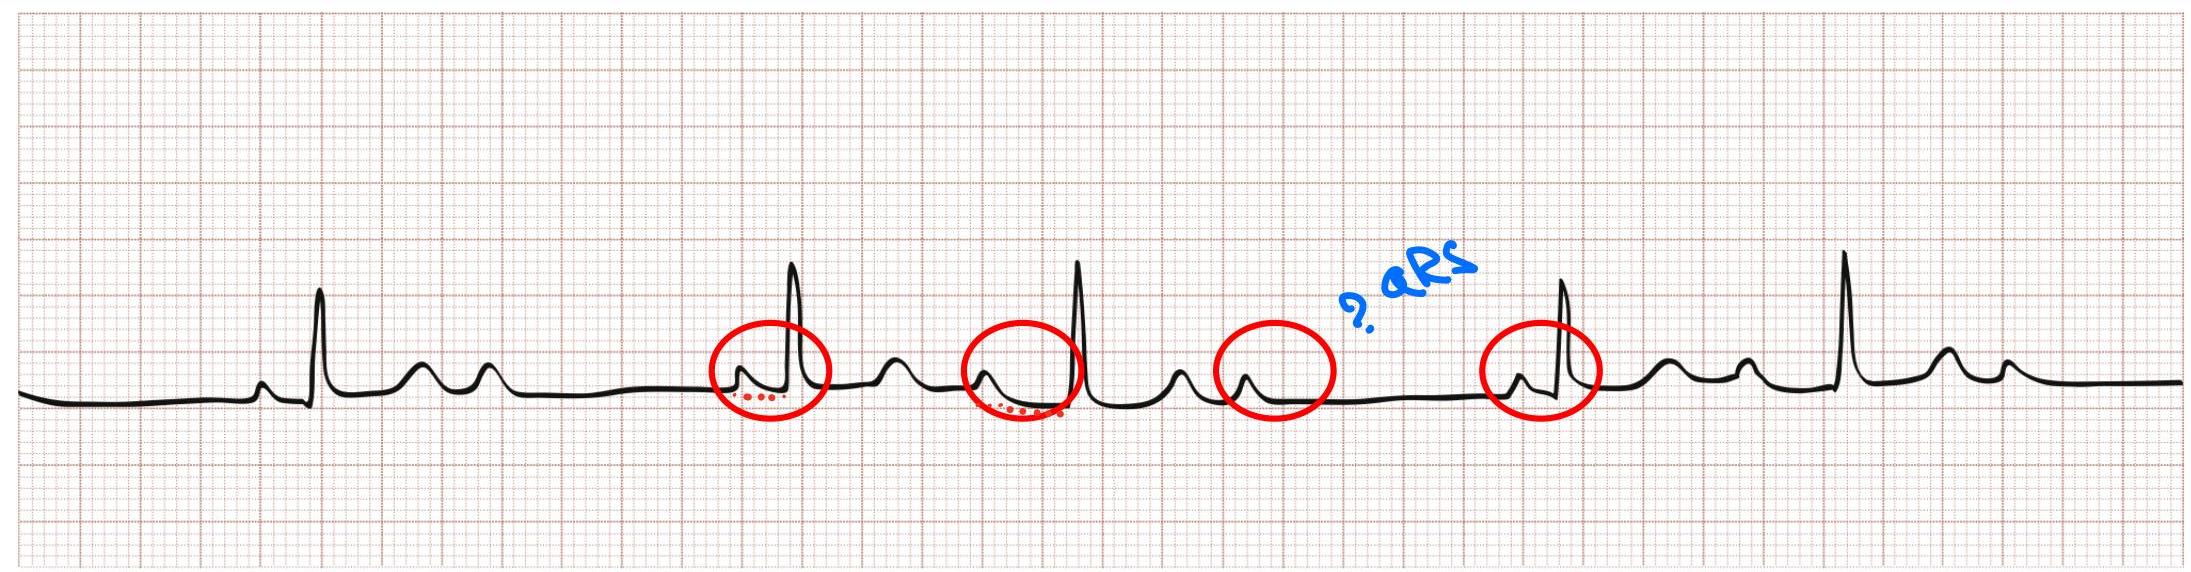
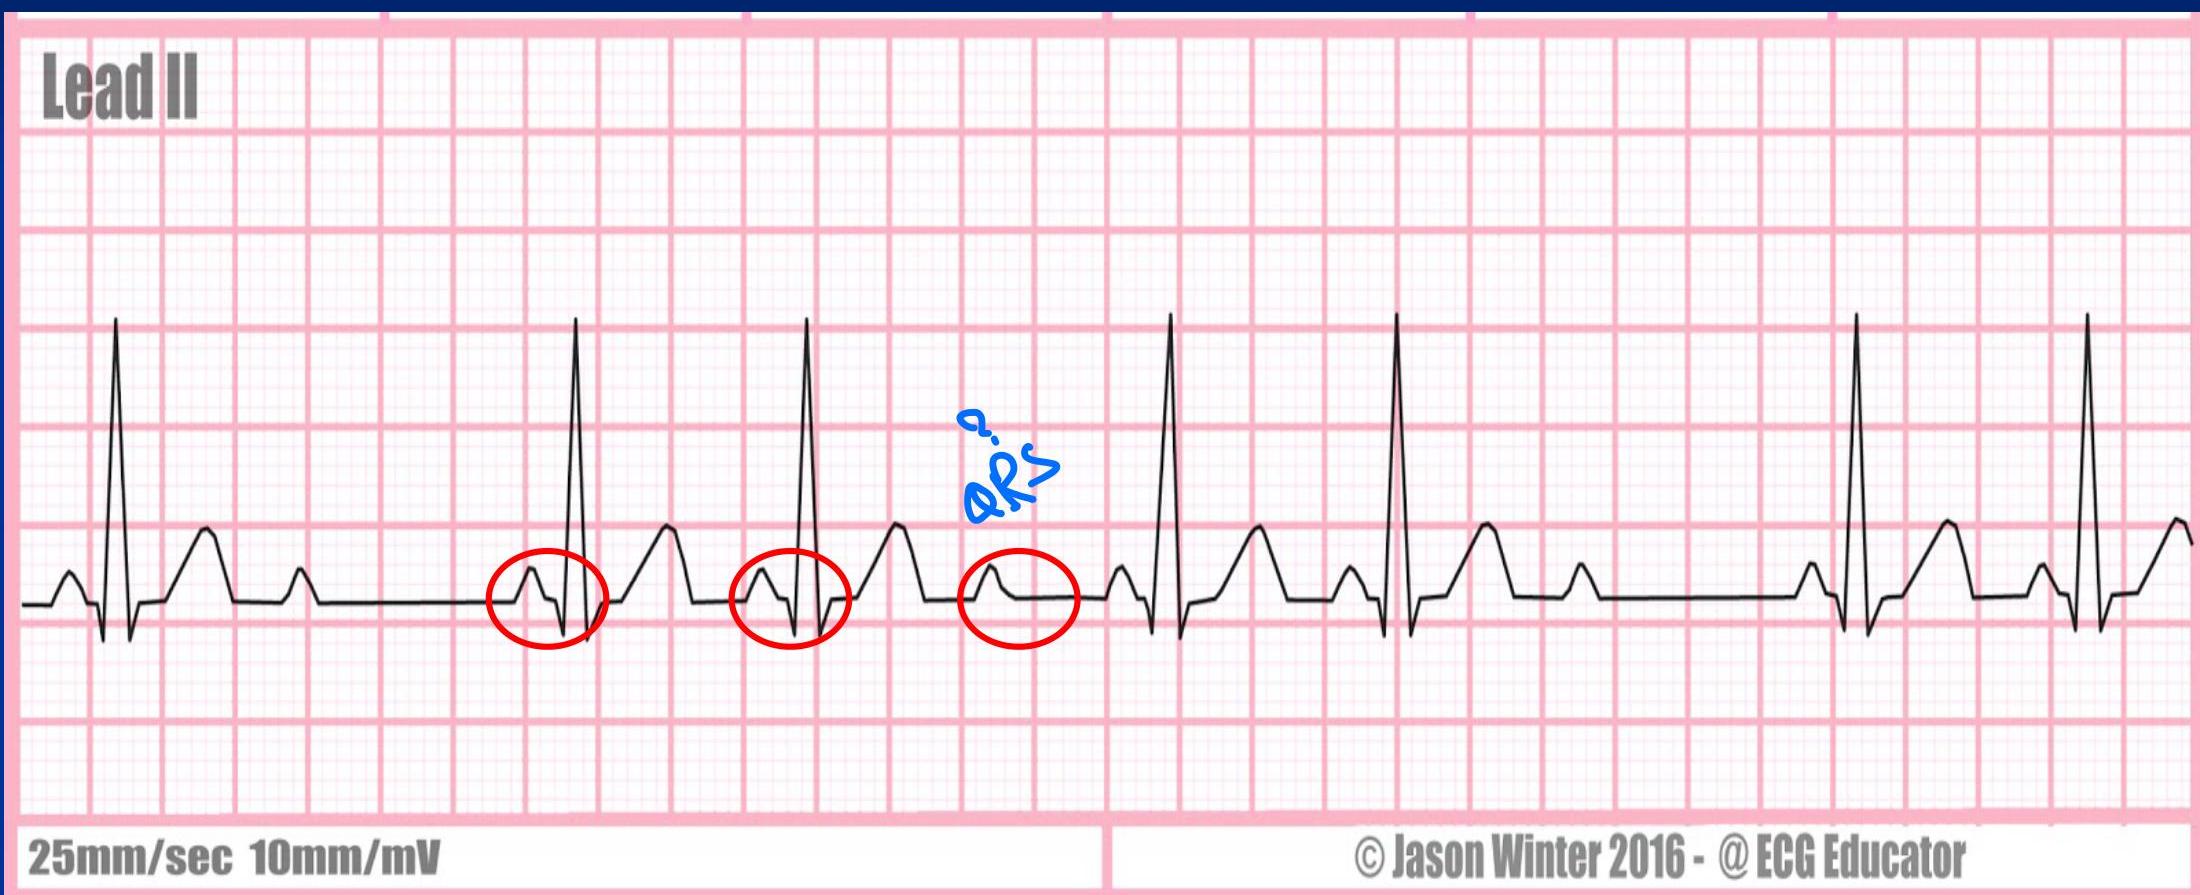
- 2nd Degree AV Block Type 2 (Mobitz II): Consistent PR interval with randomly dropped QRS complexes.
- 3rd Degree AV Block (Complete Heart Block): Complete dissociation between P waves and QRS complexes. / complete dissociation of the atria and the ventricles.
////
Short PR Interval ( less than 3 small squares / / < 0.12 sec)
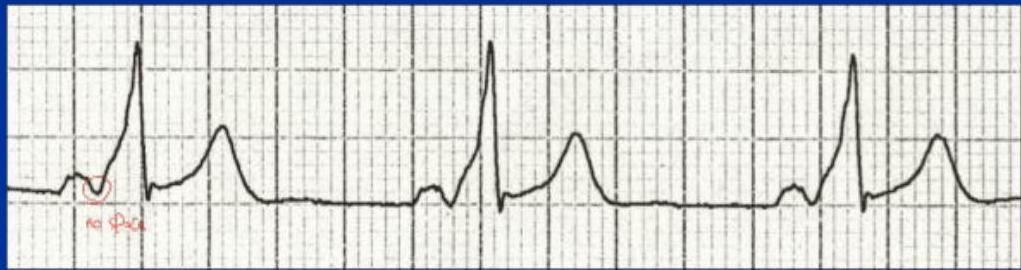
- Wolff-Parkinson-White (WPW) Syndrome: preexcitation syndromes - Delta wave present.
- AV nodal (Junctional) Rhythm: Retrograde P waves.
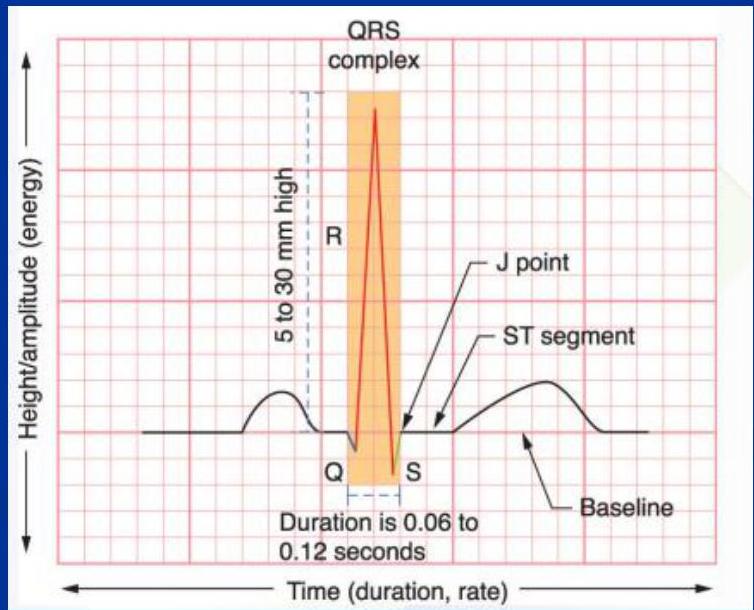
6. QRS Complex
Normal Width: <100 ms in width - < 0.10 sec (< 2.5 small squares). - 110-120 ms is grey zone Wide QRS: >120 ms is wide QRS - > 0.12 sec. i .e. >3 small squares
Causes of Wide QRS:
- Ventricular Tachycardia (VT)
- Left Bundle Branch Block (LBBB)
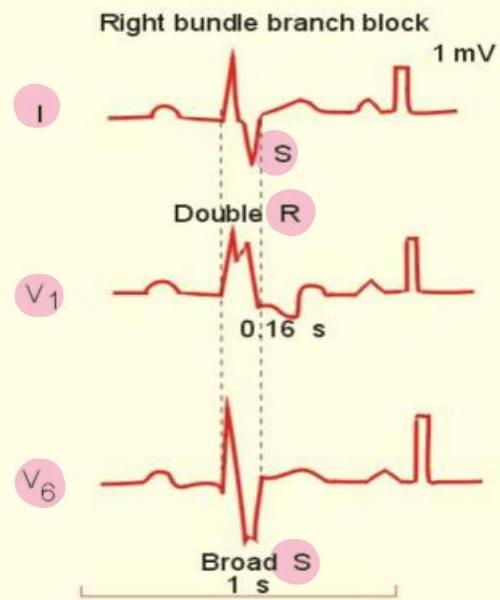
- Right Bundle Branch Block (RBBB)
- Hyperkalemia
- WPW (Antidromic type)
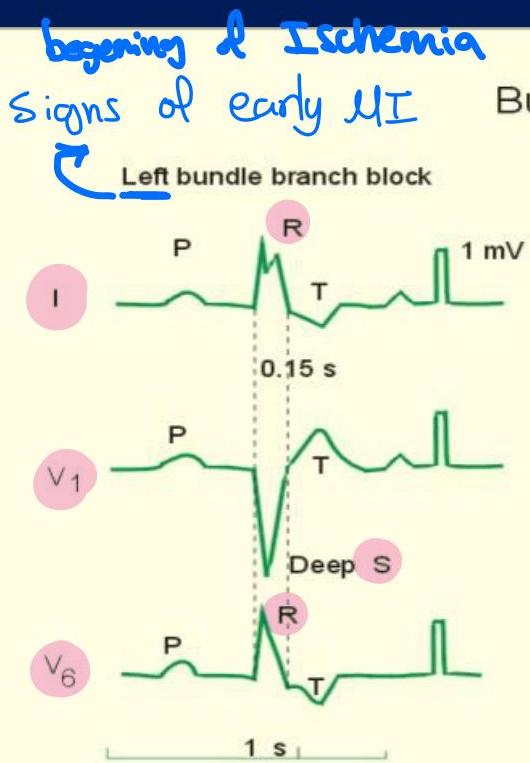
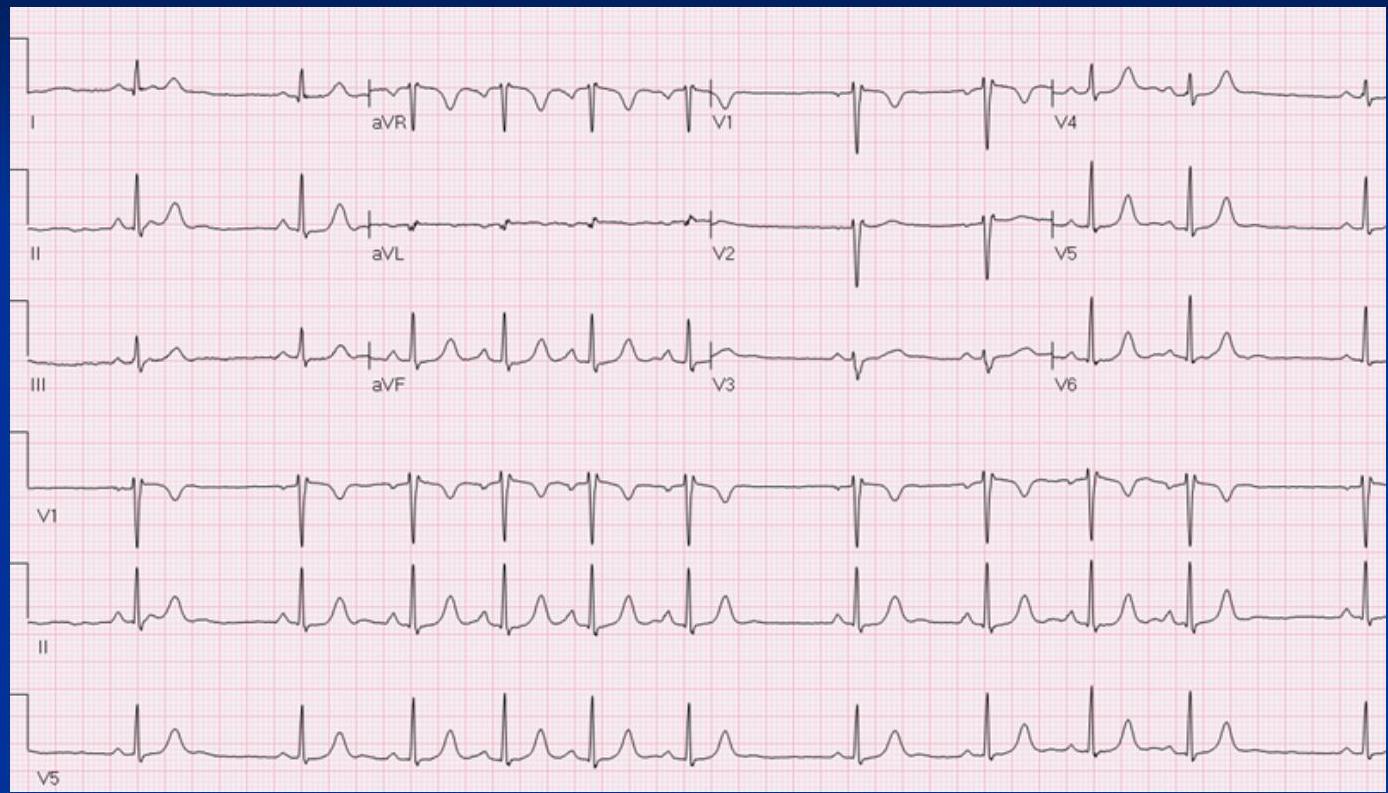
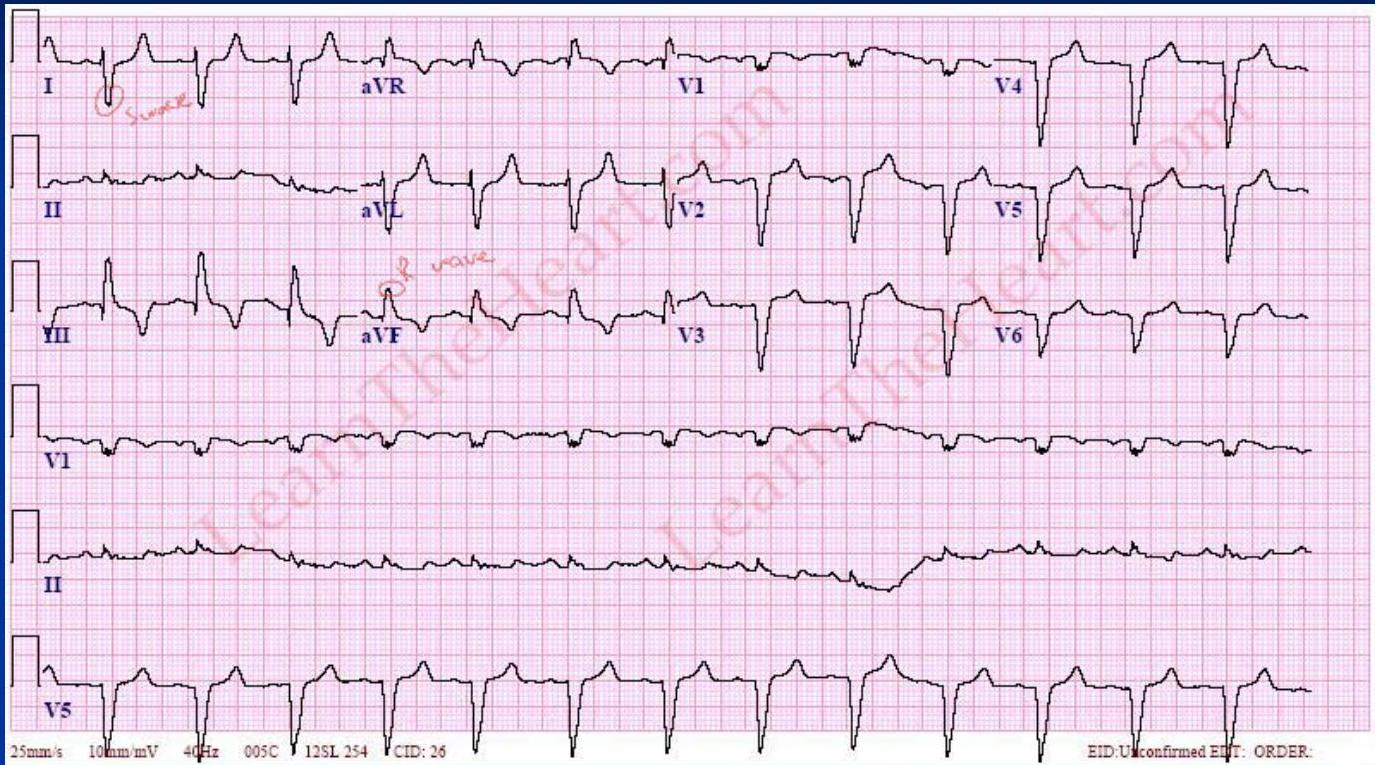
Bundle Branch Blocks:
- LBBB: Upward QRS (R wave) in I and V6; Deep S in V1. “M” pattern in V5/V6. Z (I V1 V6)
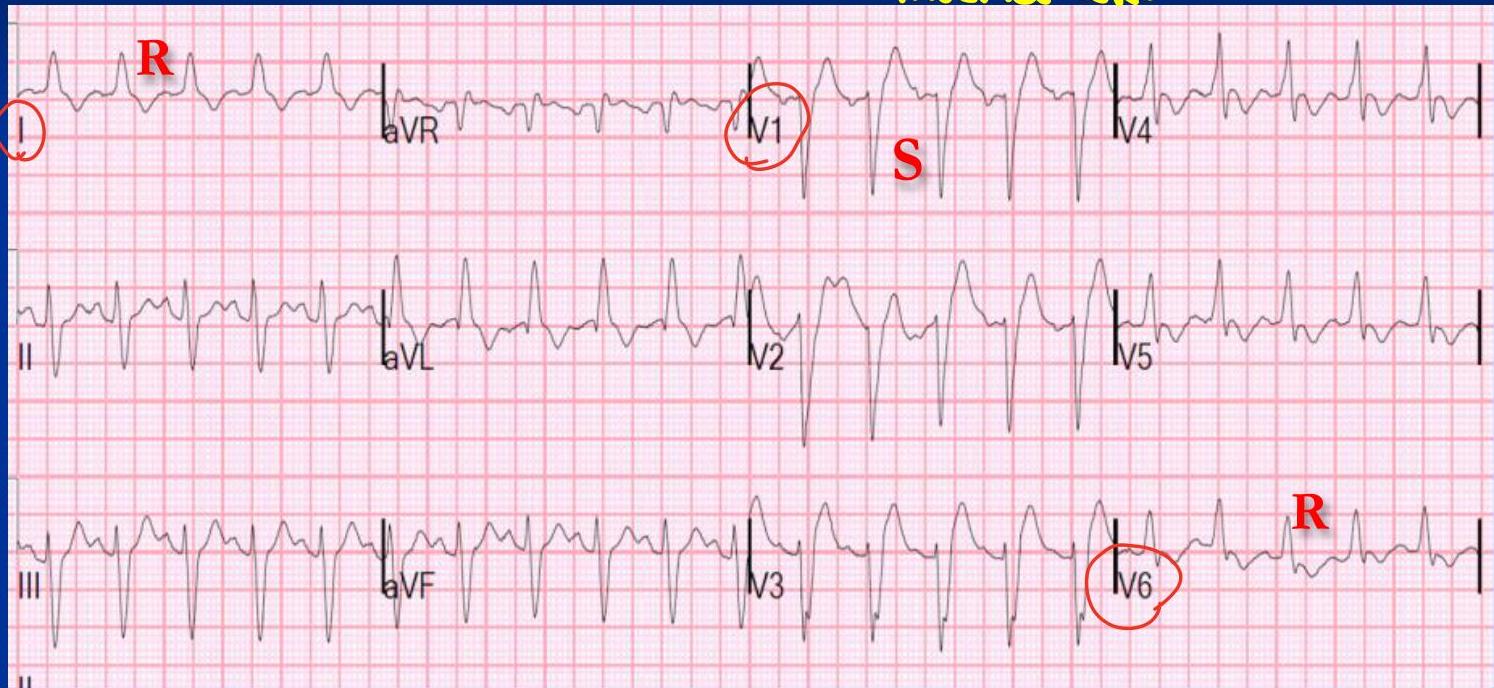
 rsr with wide qrs
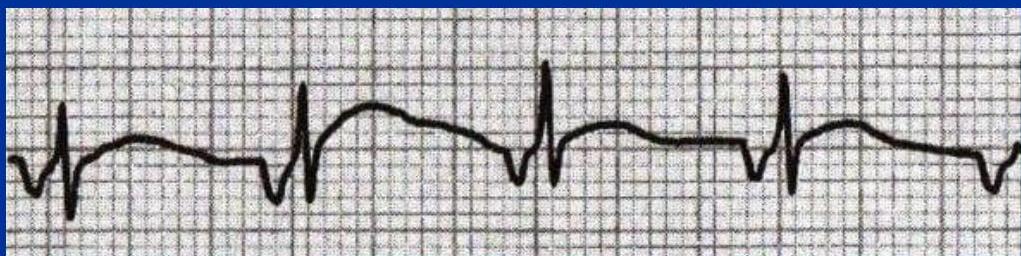
- RBBB: “M” pattern (RSR’) in V1; Slurred S wave in I and V6. (I V1 V6)
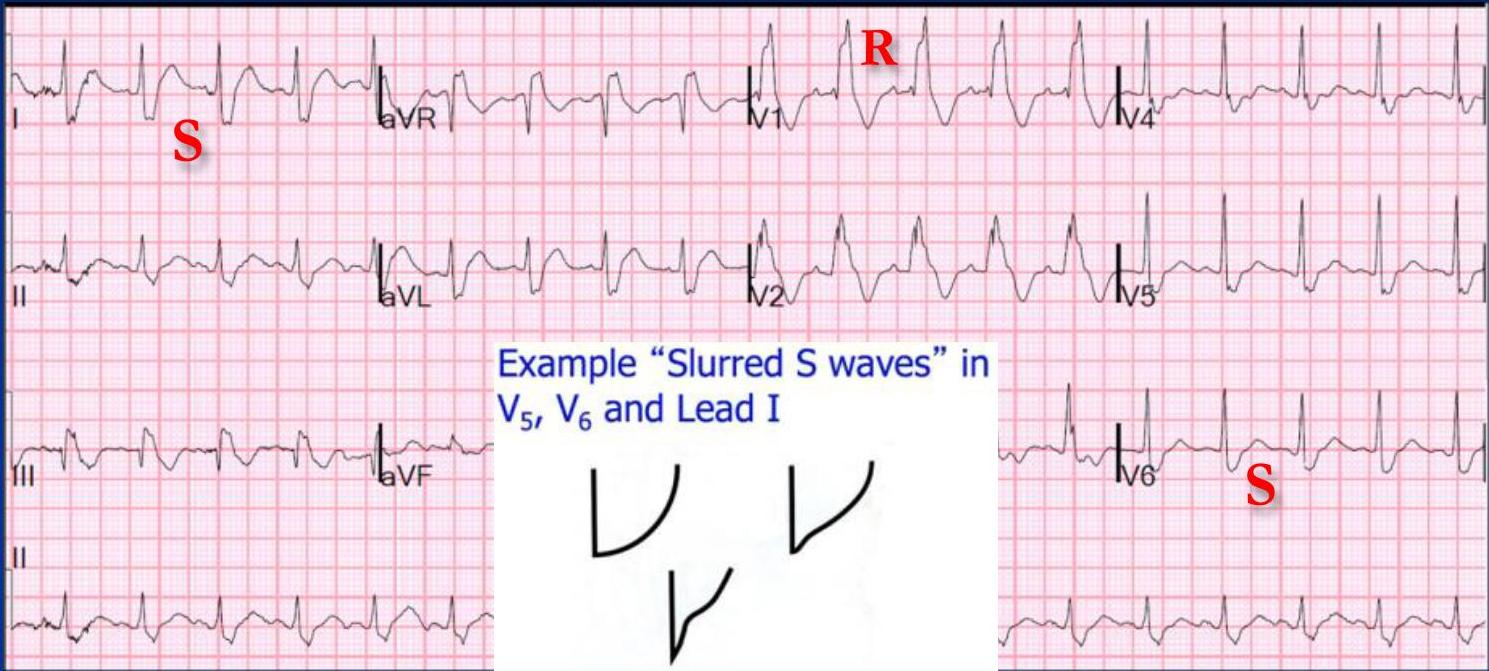
 srs wide qrs
Other Wide QRS examples:
 no p wave
unstable = shock stable =
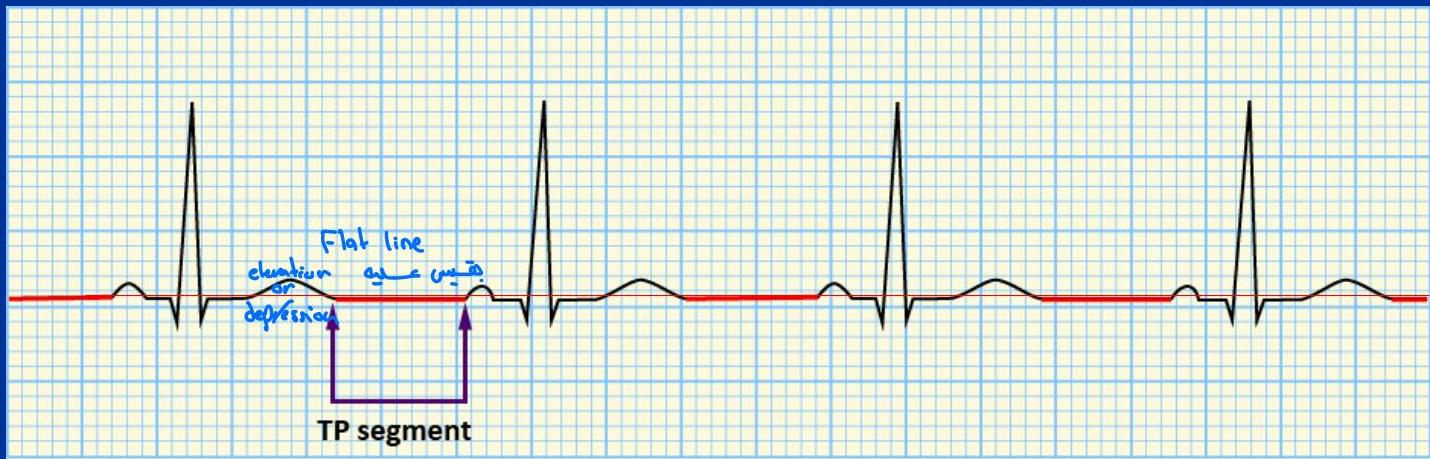
7. TP Segment
The isoelectric baseline segment used as a reference for ST elevation/depression.
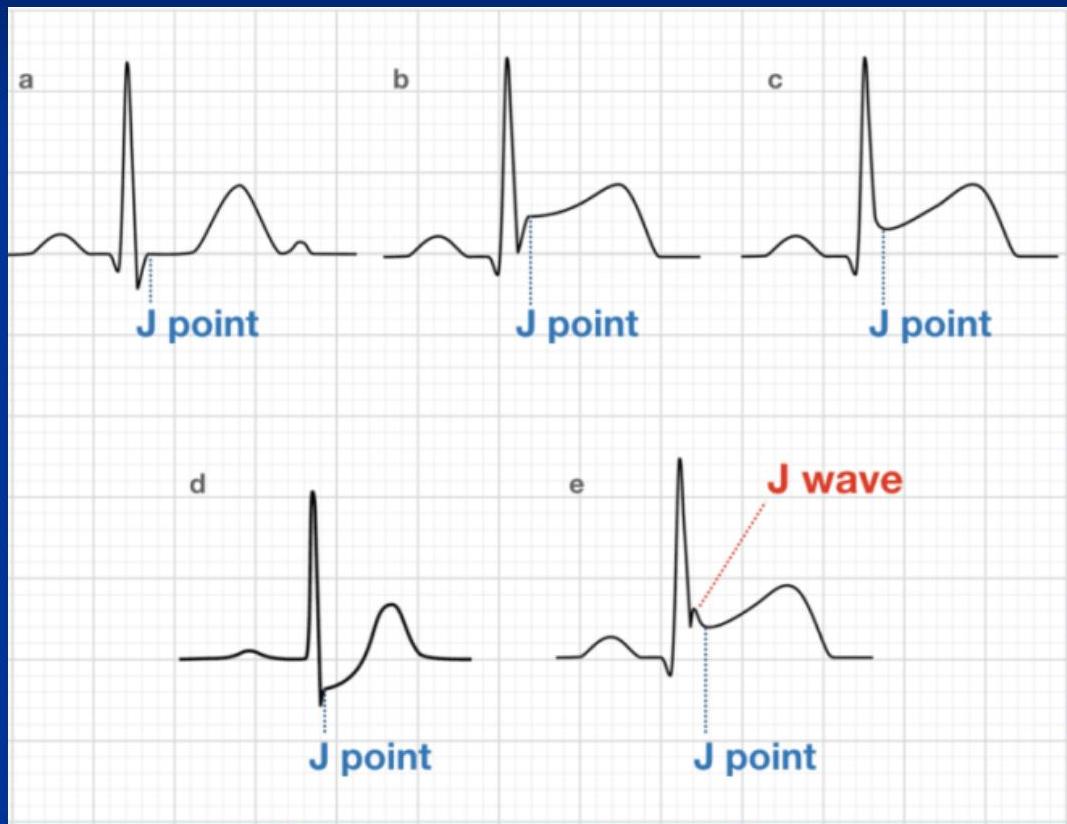
8. ST Segment
Begins at the J Point (end of QRS). Most important segment for identifying ischemia/infarction.
ST Elevation (STE)
Causes of STE
- STEMI
- Pericarditis
- Left ventricular aneurysm (LVA)
- Left ventricular hypertrophy (LVH)
- Left bundle‑branch block (LBBB)
- Prinzmetal angina
- Hyperkalemia
- Paced rhythm
- Wolff‑Parkinson‑White (WPW)
- Pulmonary embolism (PE)
- Post‑cardioversion
- Brugada syndrome
- Normal variant
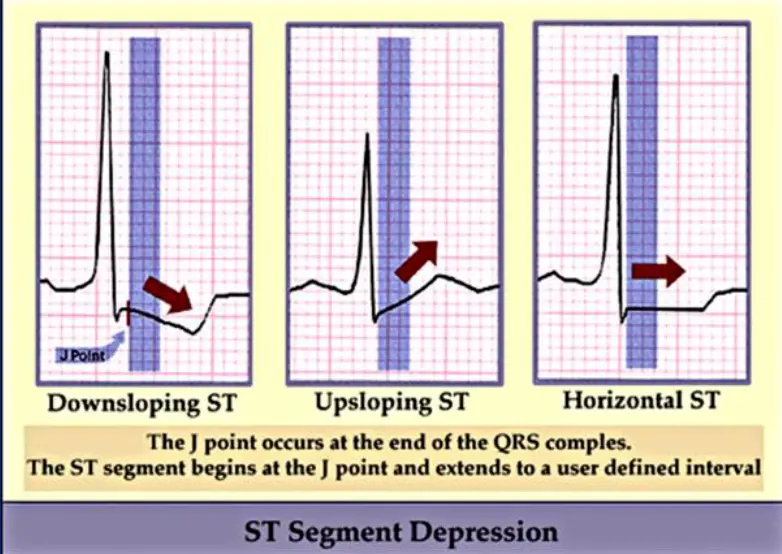
ST Depression (STD)
- Causes: Ischemia (NSTEMI), Reciprocal change, LVH/RVH, Digoxin, Hypokalemia.
- Morphology: Downsloping, Upsloping, Horizontal.
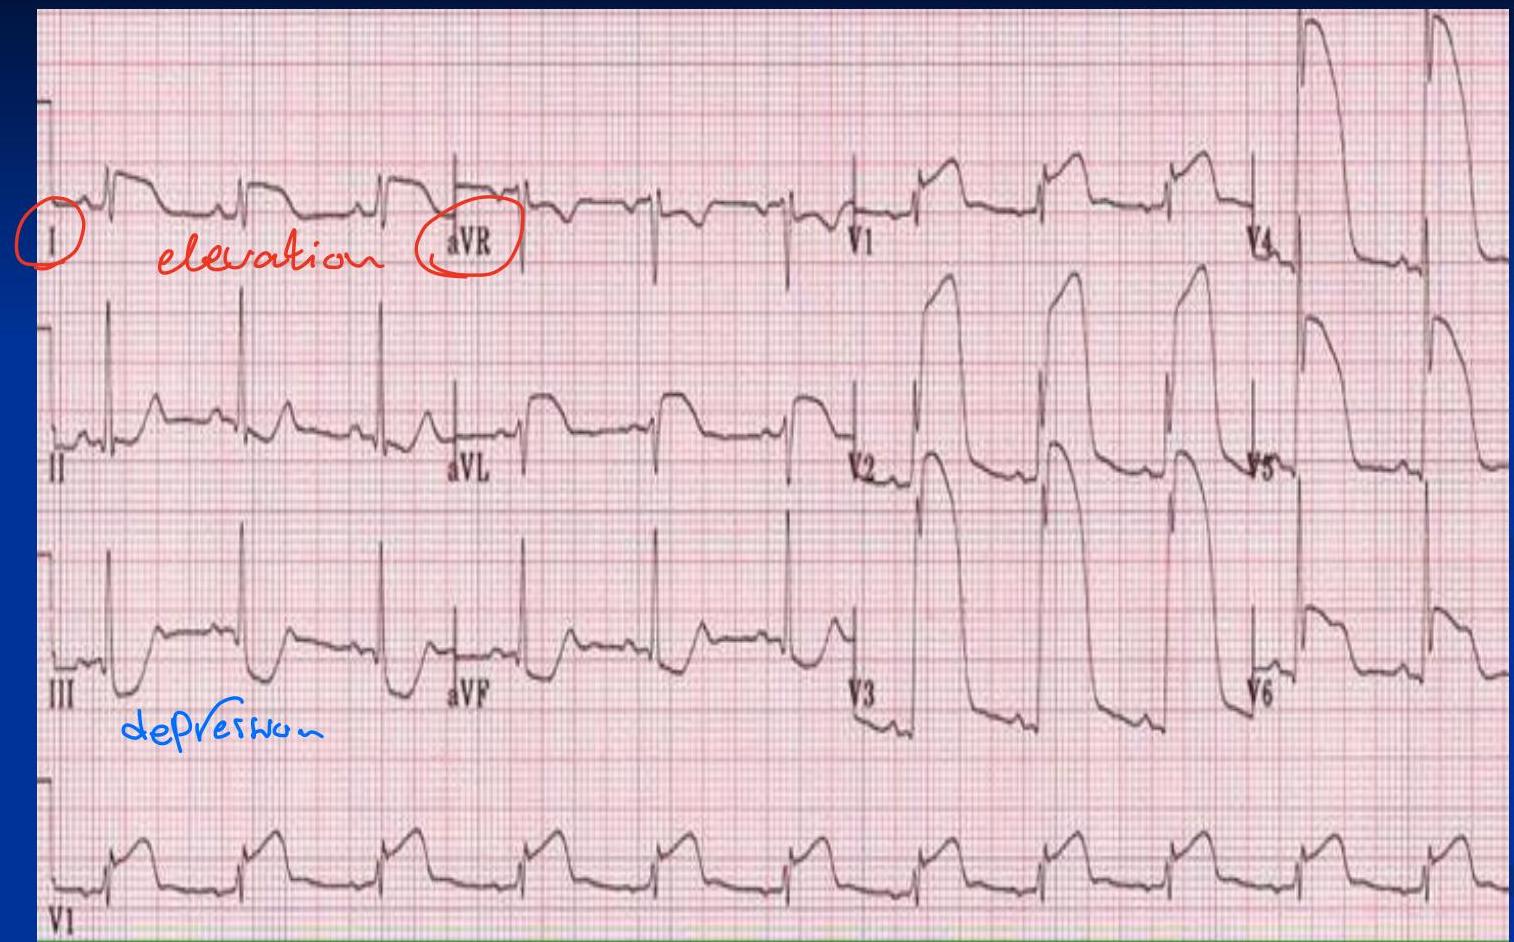
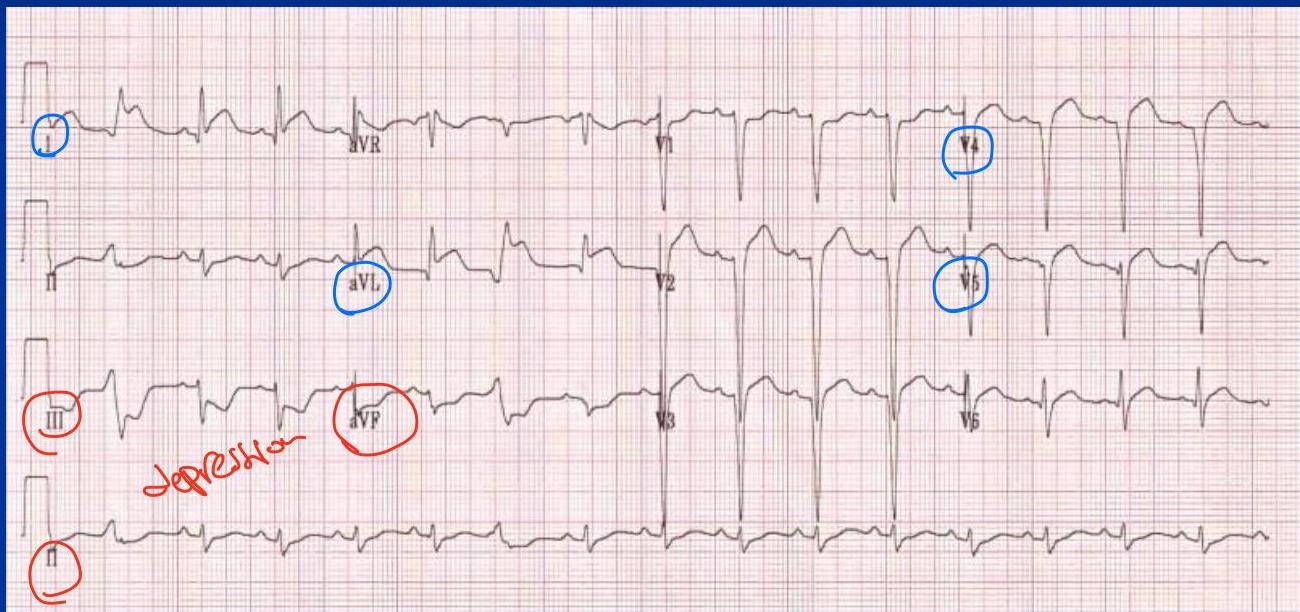
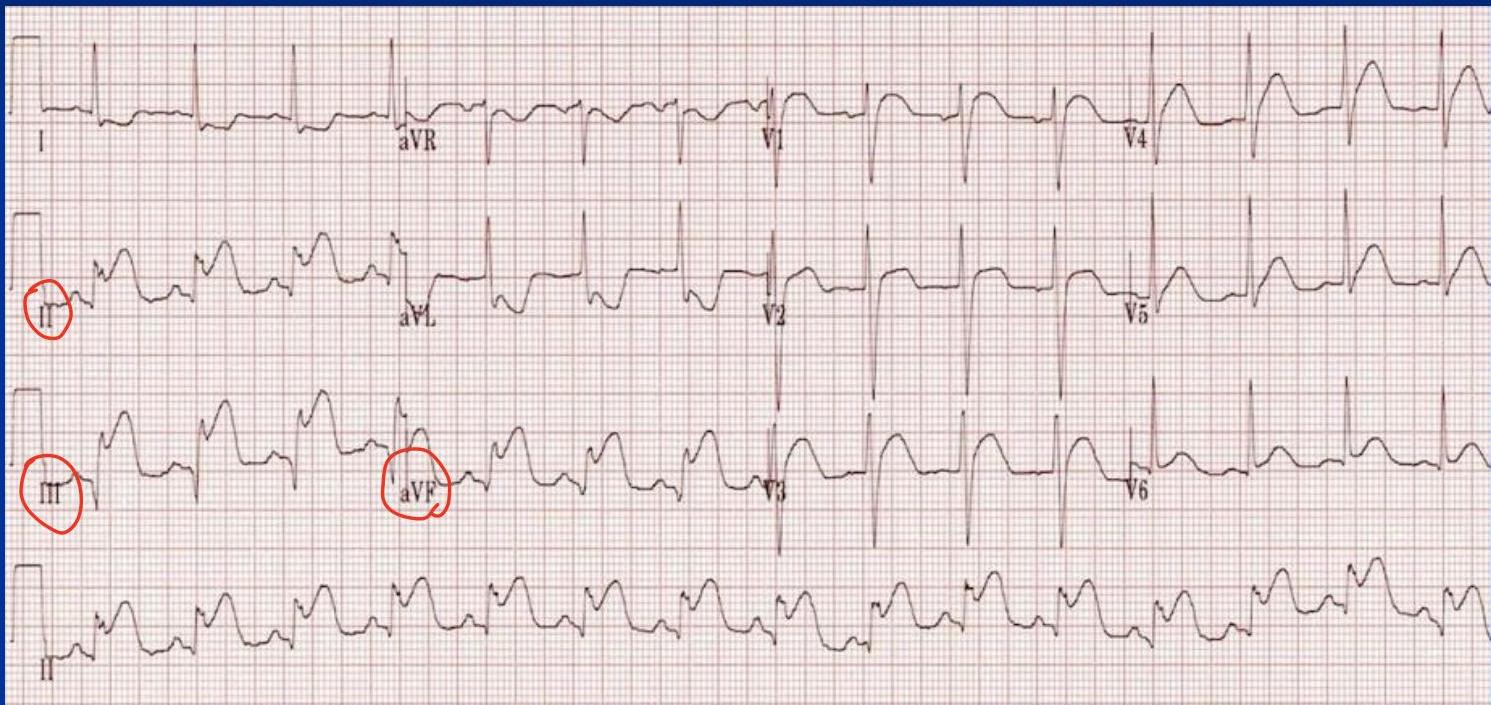
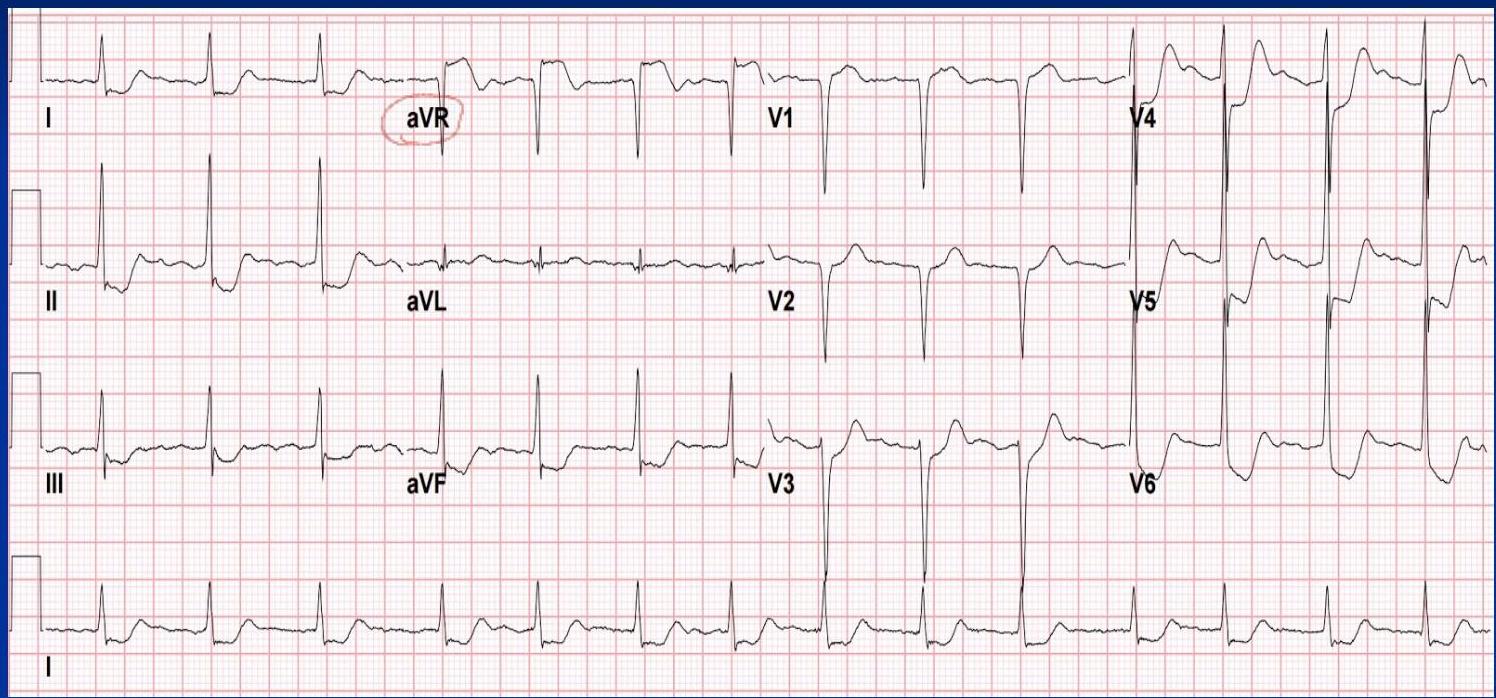
Reciprocal Changes
ST depression in leads opposite to the area of ST elevation. Highly suggestive of MI.
- Inferior (II, III, aVF) Lateral (I, aVL)
- Posterior Anterior (V1-V3)
 Reciprocal changes occur between the following regions:
- Posterior ↔ Anterior — reciprocal changes
- Anterior ↔ Inferior — reciprocal changes
- Inferior ↔ Lateral — reciprocal changes
- Lateral ↔ Inferior or Septal — reciprocal changes
- Septal ↔ Posterior — reciprocal changes
Inferior ST elevation Lateral ST depression (Reciprocal)
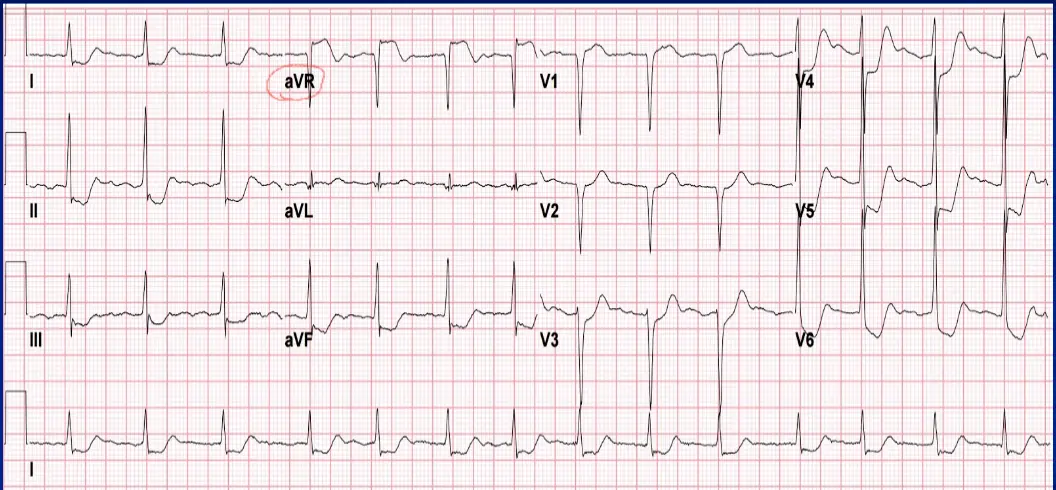
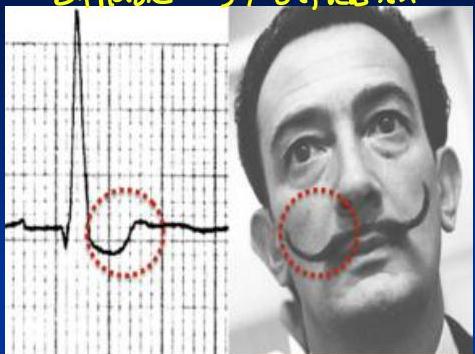
Digoxin Effect
“Scooped” ST depression (Salvador Dali mustache appearance).


Anterior ST elevation inferior ST depression (Reciprocal)
9. T Wave
Normal:
- Amplitude: 1/3 — 2/3 of R wav
- Width: 0.2 -0.3 second
- Orientation: positive in most leads except AVR ,V1 - Upright in most leads (inverted in aVR, sometimes V1).
The most sensitive part for any injury (repolarization is an active process) is reflected in the following patterns:
- Hyperacute – seen in myocardial infarction (MI), high K⁺, early repolarization
- Flat – characteristic of hypokalemia
- Flip – associated with pulmonary embolism (PE) and MI
These three patterns—hyperacute, flat, and flip—help differentiate the underlying cause of the repolarization changes.
Abnormalities:
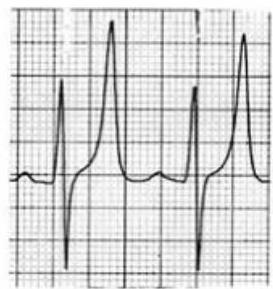
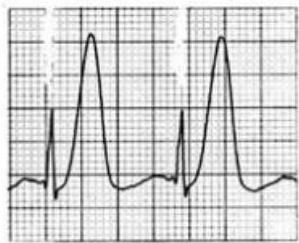
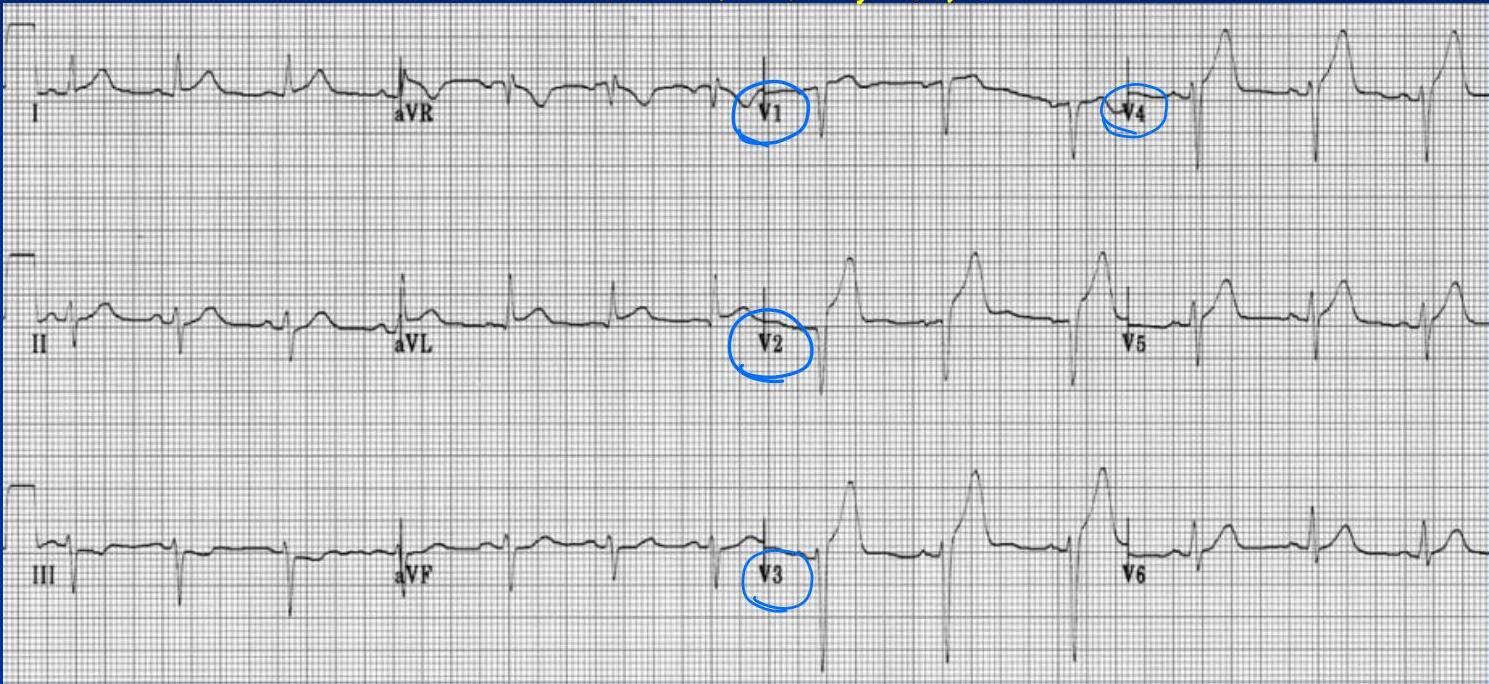
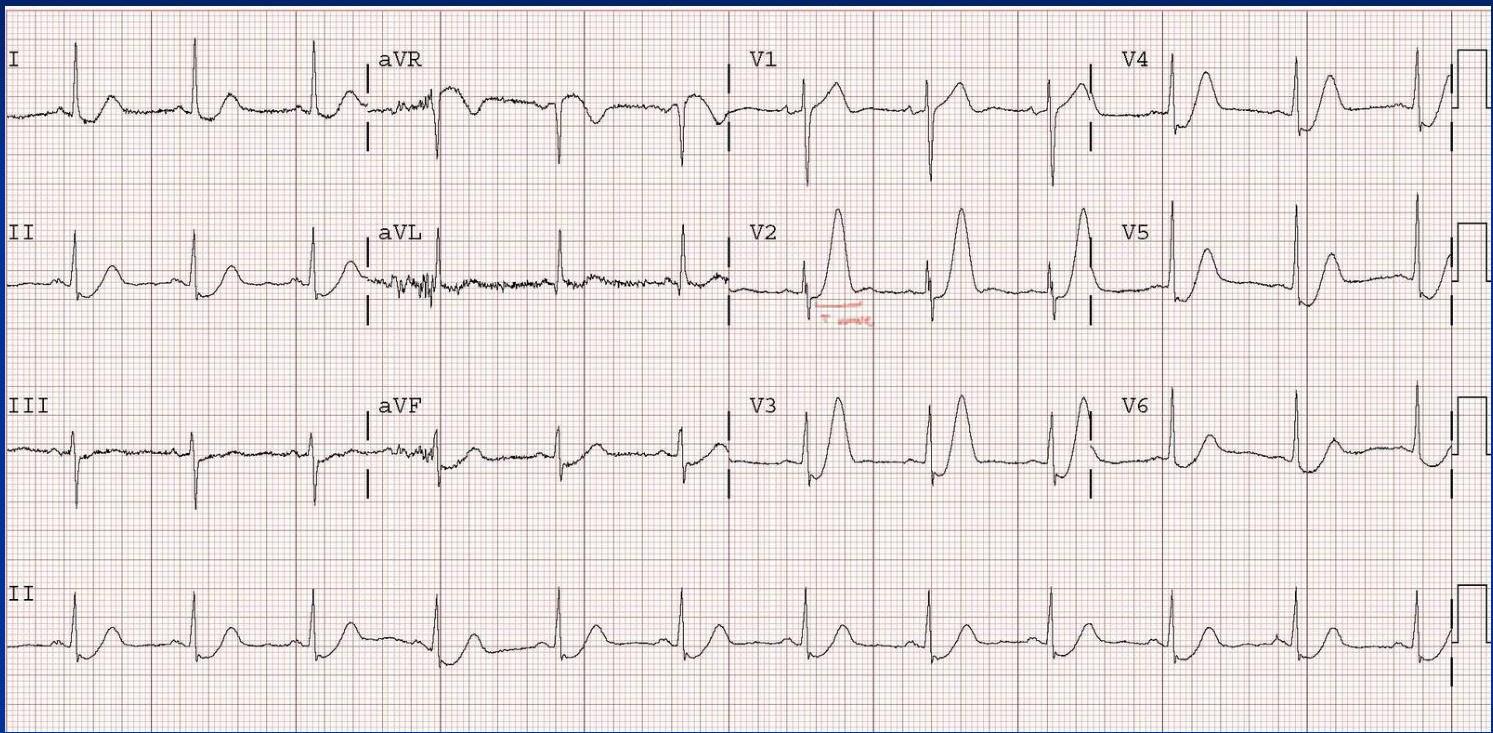
- Hyperkalemia: Symmetric, Tall, peaked, pointed, narrow-based (“tenting”) T waves.
- Hyperacute Ischemia: Broad-based, tall T waves. - symmetric - not tented , not pointed, qt interval tends to be long (not in this example)
- Inverted T Waves: Myocardial Ischemia / anterior MI
- Normal Variant: Assymetric and not narrow
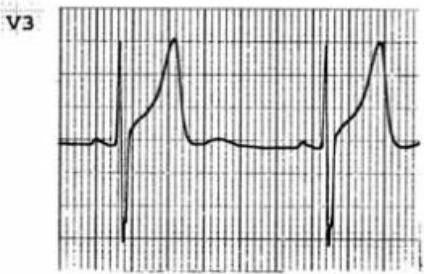
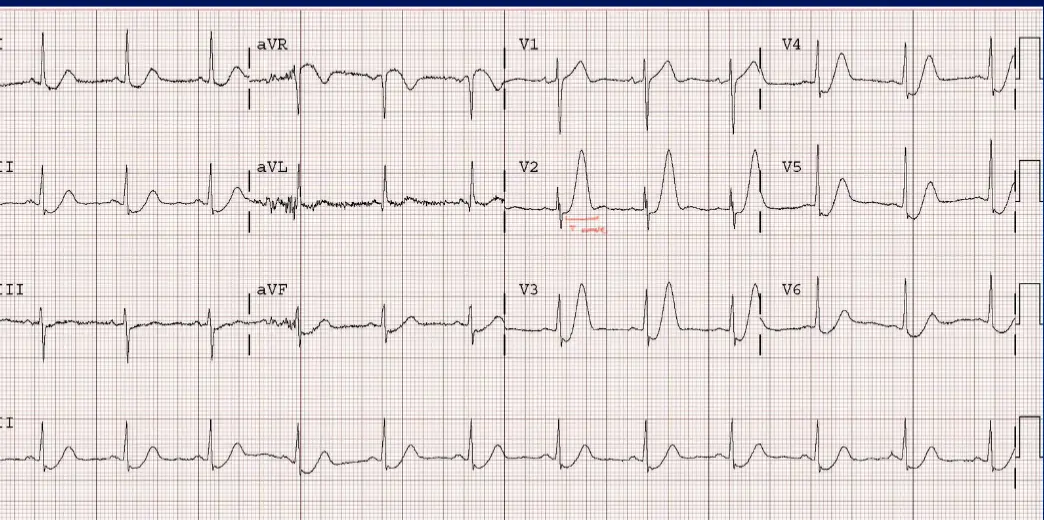 Hyperkalemia / ischemia
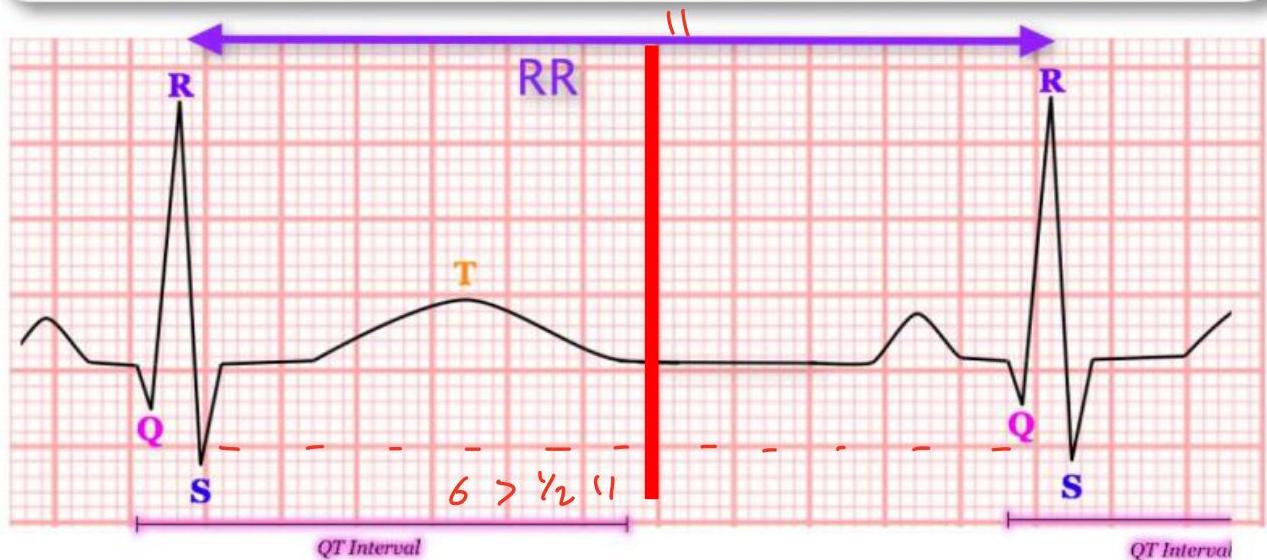
10. QT Interval
Measured from start of QRS to end of T wave. Represents total ventricular activity. Bazett’s Formula for QTc (Corrected QT):
QTc = Corrected qt interval QT interval = Q wave to end of T wave RR = Time from two consecutive R waves
Normal Values:
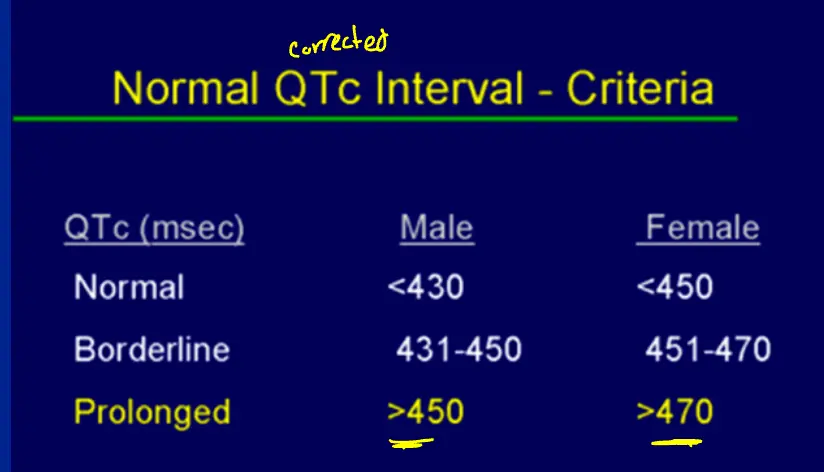
Prolonged QT: (If the QT is more than 50% of the R-R , it is prolonged)
- Risk: Torsades de Pointes (Polymorphic VT).
- Causes: Hypokalemia, Hypomagnesemia, Hypocalcemia, Drugs (Macrolides, TCAs, Antipsychotics), Congenital.
Hypomagnesemia, Hypokalemia, Hypocalcemia
Short QT:
- Causes: Short QT syndrome, Hypercalcemia.
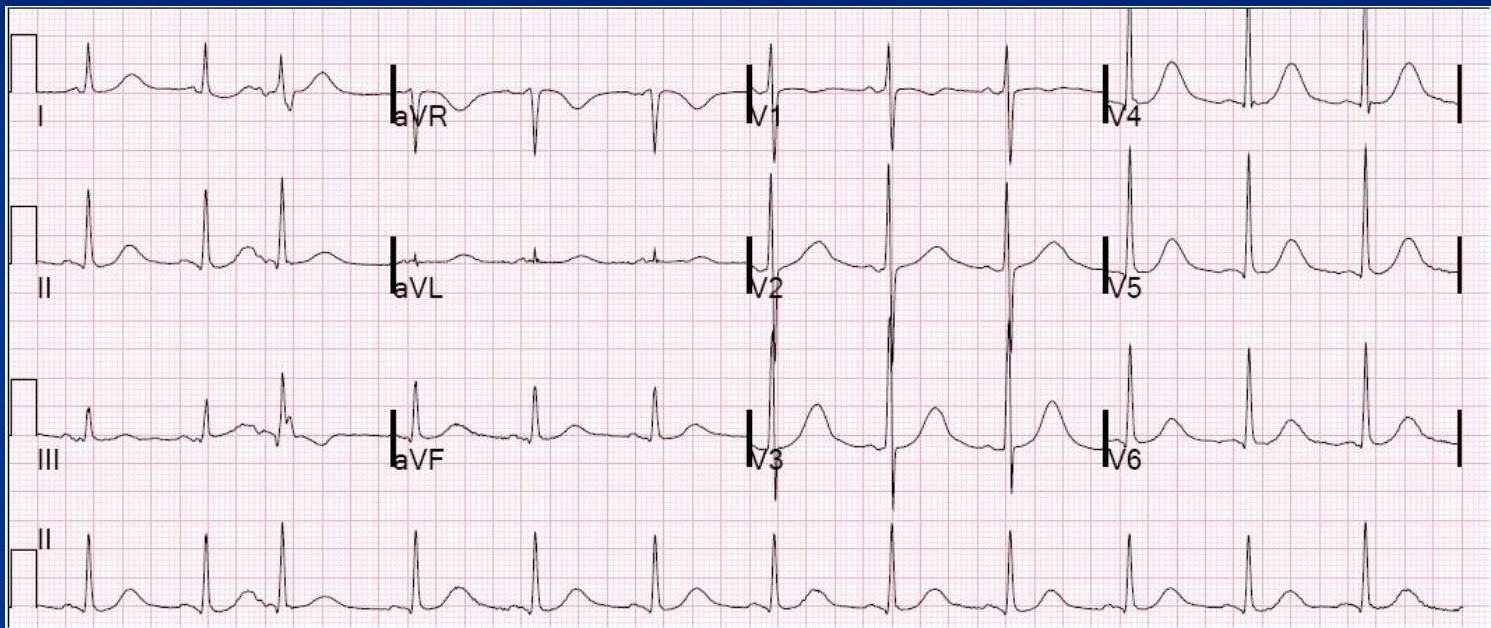
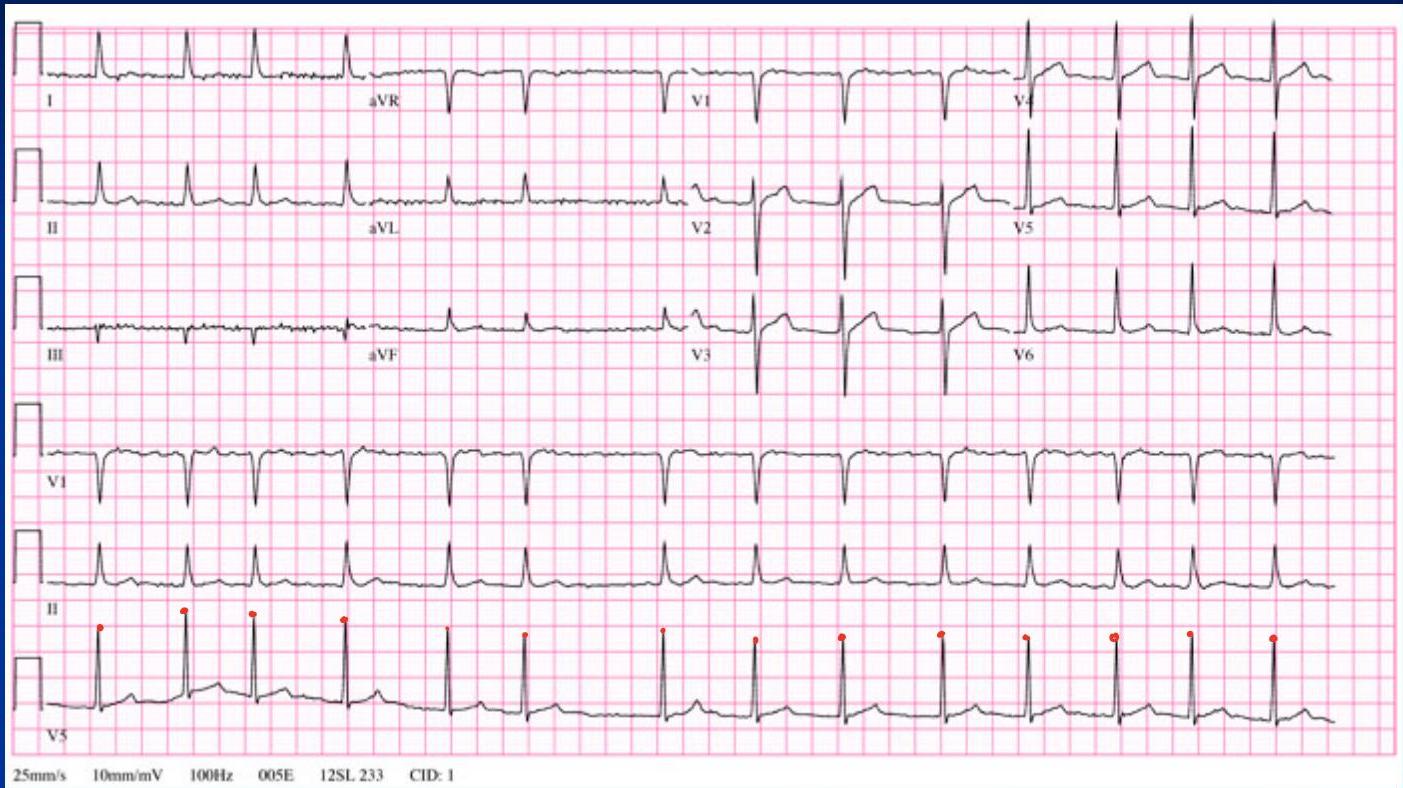
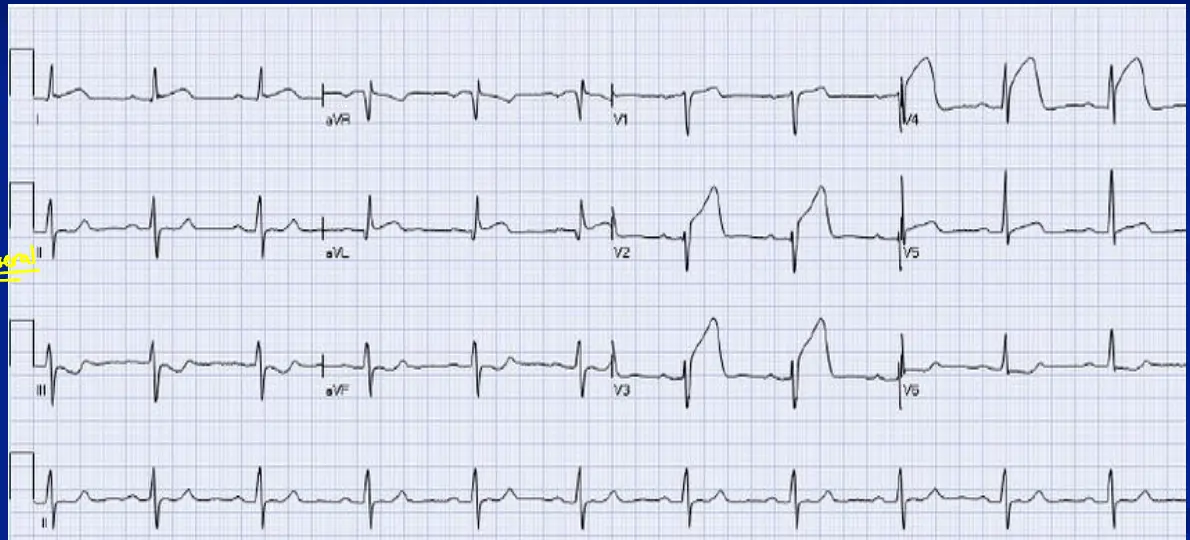
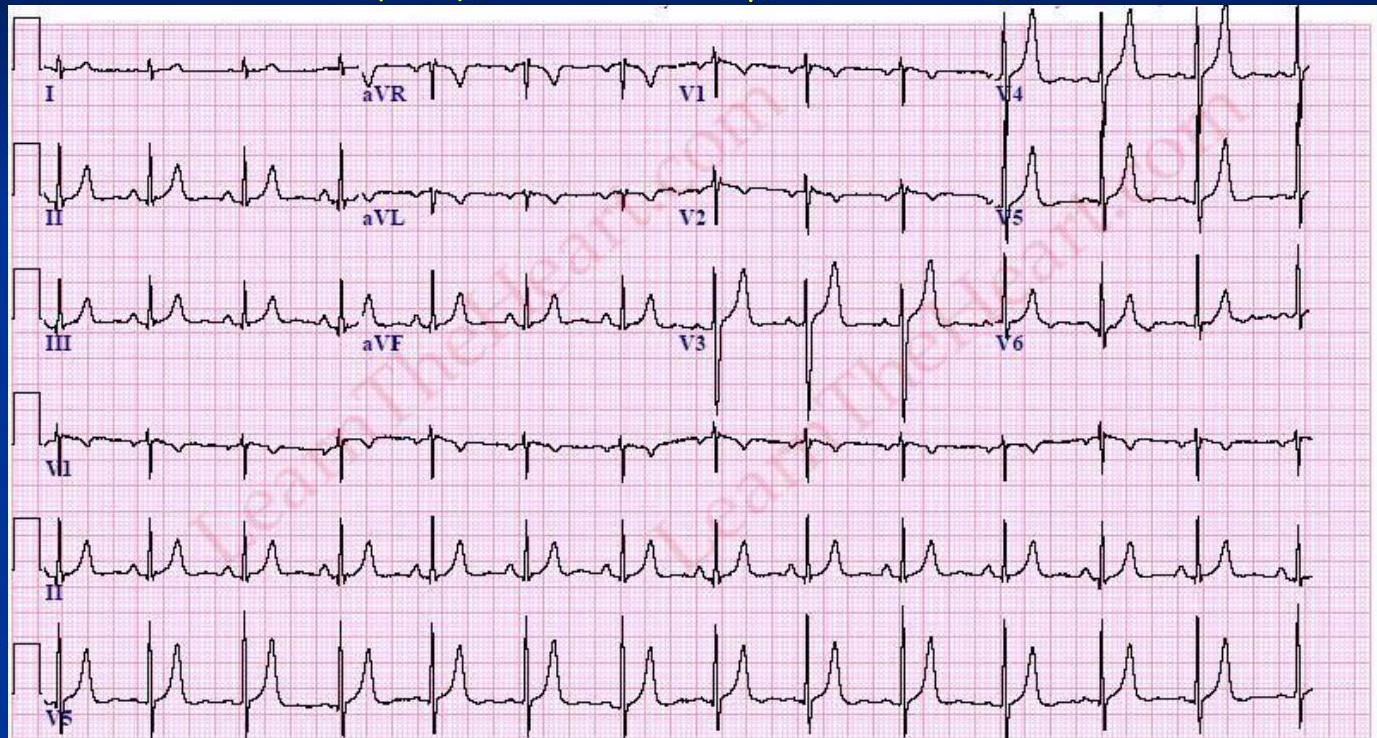
Practice Quiz
1. Calculate the HR

2. Sinus Rhythm?
3. Right or Left Axis?
4. LBBB or RBBB?
5. ST Segment Elevation?
6. Normal T Waves?
7. Prolonged QT?